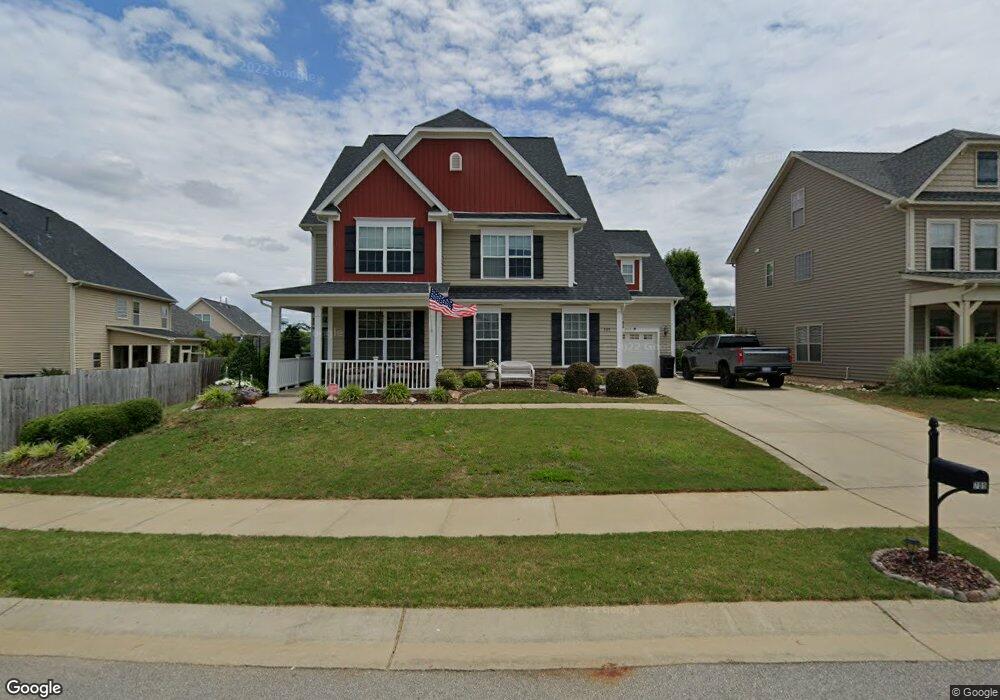
705 Silk Tree Trace Fuquay Varina, NC 27526
Estimated Value: $485,704 - $559,000
--
Bed
1
Bath
2,885
Sq Ft
$177/Sq Ft
Est. Value
About This Home
This home is located at 705 Silk Tree Trace, Fuquay Varina, NC 27526 and is currently estimated at $510,426, approximately $176 per square foot. 705 Silk Tree Trace is a home with nearby schools including Fuquay-Varina High, Achievement Charter Academy, and Southern Wake Academy.
Ownership History
Date
Name
Owned For
Owner Type
Purchase Details
Closed on
Jun 7, 2016
Sold by
Pucciarelli Albert C
Bought by
Pucciarelli Albert C and Pucciarelli Deanna M
Current Estimated Value
Purchase Details
Closed on
Aug 26, 2013
Sold by
Pucciarelli Albert and Pucciarelli Claire
Bought by
Pucciarelli Albert C and Pucciarelli Albert
Purchase Details
Closed on
Jul 19, 2012
Sold by
Royal Oaks Building Group Llc
Bought by
Pucciarelli Albert and Pucciarelli Claire
Home Financials for this Owner
Home Financials are based on the most recent Mortgage that was taken out on this home.
Original Mortgage
$213,369
Interest Rate
3.7%
Mortgage Type
FHA
Purchase Details
Closed on
Mar 15, 2012
Sold by
Parker Pointe Llc
Bought by
Royal Oaks Building Group Llc
Home Financials for this Owner
Home Financials are based on the most recent Mortgage that was taken out on this home.
Original Mortgage
$184,400
Interest Rate
3.9%
Mortgage Type
Construction
Create a Home Valuation Report for This Property
The Home Valuation Report is an in-depth analysis detailing your home's value as well as a comparison with similar homes in the area
Home Values in the Area
Average Home Value in this Area
Purchase History
| Date | Buyer | Sale Price | Title Company |
|---|---|---|---|
| Pucciarelli Albert C | $2,500 | None Available | |
| Pucciarelli Albert C | $2,500 | None Available | |
| Pucciarelli Albert | $231,000 | None Available | |
| Royal Oaks Building Group Llc | $110,000 | None Available |
Source: Public Records
Mortgage History
| Date | Status | Borrower | Loan Amount |
|---|---|---|---|
| Previous Owner | Pucciarelli Albert | $213,369 | |
| Previous Owner | Royal Oaks Building Group Llc | $184,400 |
Source: Public Records
Tax History Compared to Growth
Tax History
| Year | Tax Paid | Tax Assessment Tax Assessment Total Assessment is a certain percentage of the fair market value that is determined by local assessors to be the total taxable value of land and additions on the property. | Land | Improvement |
|---|---|---|---|---|
| 2025 | $2,176 | $492,759 | $100,000 | $392,759 |
| 2024 | $2,167 | $492,759 | $100,000 | $392,759 |
| 2023 | $1,745 | $310,227 | $65,000 | $245,227 |
| 2022 | $1,640 | $310,227 | $65,000 | $245,227 |
| 2021 | $1,563 | $310,227 | $65,000 | $245,227 |
| 2020 | $1,563 | $310,227 | $65,000 | $245,227 |
| 2019 | $2,999 | $258,355 | $60,000 | $198,355 |
| 2018 | $2,828 | $258,355 | $60,000 | $198,355 |
| 2017 | $2,726 | $258,355 | $60,000 | $198,355 |
| 2016 | $2,689 | $258,355 | $60,000 | $198,355 |
| 2015 | $2,461 | $244,179 | $52,000 | $192,179 |
| 2014 | -- | $244,179 | $52,000 | $192,179 |
Source: Public Records
Map
Nearby Homes
- 610 Silk Tree Trace
- 848 Red Oak Tree Dr
- 513 Aspen Grove Dr
- 904 Bridlemine Dr
- 509 Timber Meadow Lake Dr
- 1113 Matisse Dr
- 1036 Steelhorse Dr
- 817 Stable Fern Dr
- 837 Stable Fern Dr
- 909 Sunset Dr
- 1114 Bridlemine Dr
- 516 Smithridge Way
- 857 Stable Fern Dr
- 633 Prickly Pear Dr
- 917 Stable Fern Dr
- 925 Arnold Place Dr
- 716 Parker St
- 817 Leatherstone Ln
- 1050 Wagstaff Rd
- 1000 Wagstaff Rd
- 711 Silk Tree Trace
- 701 Silk Tree Trace
- 841 Sequoia Ridge Dr
- 715 Silk Tree Trace
- 909 Sequoia Ridge Dr
- 823 Ribbonleaf Ln
- 706 Silk Tree Trace
- 835 Ribbonleaf Ln
- 835 Sequoia Ridge Dr
- 712 Silk Tree Trace
- 719 Silk Tree Trace
- 913 Sequoia Ridge Dr
- 841 Ribbonleaf Ln
- 716 Silk Tree Trace
- 829 Sequoia Ridge Dr
- 723 Silk Tree Trace
- 847 Ribbonleaf Ln
- 720 Silk Tree Trace
- 874 Bartek Ct
- 822 Ribbonleaf Ln