Estimated Value: $275,000 - $300,000
3
Beds
2
Baths
1,700
Sq Ft
$169/Sq Ft
Est. Value
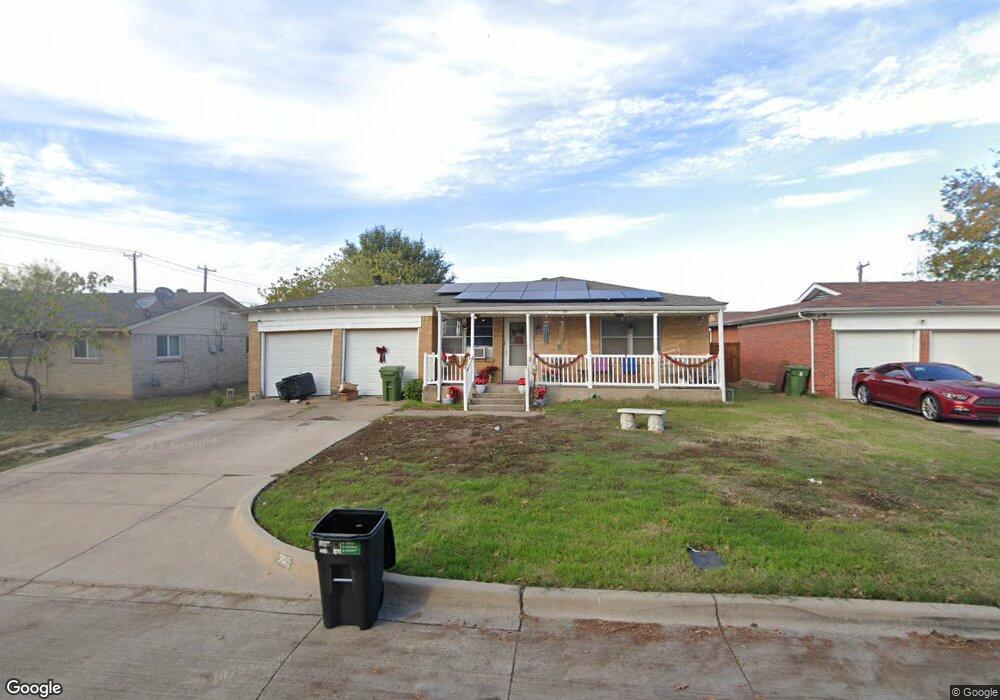
About This Home
This home is located at 705 Tanglewood Dr, Hurst, TX 76053 and is currently estimated at $287,214, approximately $168 per square foot. 705 Tanglewood Dr is a home located in Tarrant County with nearby schools including Bellaire Elementary School, Hurst J High School, and L.D. Bell High School.
Ownership History
Date
Name
Owned For
Owner Type
Purchase Details
Closed on
May 10, 2024
Sold by
Howard George Robert and Meegan Janet
Bought by
Howard Susan R
Current Estimated Value
Purchase Details
Closed on
Jun 20, 2023
Sold by
Howard Susan Roberta
Bought by
Meegan Janet Louise
Purchase Details
Closed on
Dec 17, 2021
Sold by
Crooke Deborah
Bought by
Howard George Robert
Purchase Details
Closed on
Dec 13, 2021
Sold by
Lafayette Howard Robert
Bought by
Howard George Robert
Purchase Details
Closed on
Jul 26, 2021
Sold by
Mcdowell Melinda
Bought by
Howard George Robert
Purchase Details
Closed on
Jul 24, 2021
Sold by
Mcdowell Patrick
Bought by
Howard George Robert
Purchase Details
Closed on
Jul 21, 2021
Sold by
Howard John William
Bought by
Howard George Robert
Create a Home Valuation Report for This Property
The Home Valuation Report is an in-depth analysis detailing your home's value as well as a comparison with similar homes in the area
Home Values in the Area
Average Home Value in this Area
Purchase History
| Date | Buyer | Sale Price | Title Company |
|---|---|---|---|
| Howard Susan R | -- | None Listed On Document | |
| Meegan Janet Louise | -- | None Listed On Document | |
| Howard George Robert | -- | None Available | |
| Howard George Robert | -- | None Listed On Document | |
| Howard George Robert | -- | None Listed On Document | |
| Howard George Robert | -- | None Available | |
| Howard George Robert | -- | None Available | |
| Howard George Robert | -- | None Available |
Source: Public Records
Tax History
| Year | Tax Paid | Tax Assessment Tax Assessment Total Assessment is a certain percentage of the fair market value that is determined by local assessors to be the total taxable value of land and additions on the property. | Land | Improvement |
|---|---|---|---|---|
| 2025 | $317 | $244,999 | $35,000 | $209,999 |
| 2024 | $317 | $244,999 | $35,000 | $209,999 |
| 2023 | $2,744 | $246,874 | $35,000 | $211,874 |
| 2022 | $2,867 | $239,638 | $35,000 | $204,638 |
| 2021 | $2,730 | $185,267 | $35,000 | $150,267 |
| 2020 | $2,476 | $173,508 | $35,000 | $138,508 |
| 2019 | $2,290 | $177,338 | $35,000 | $142,338 |
| 2018 | $540 | $85,051 | $19,000 | $66,051 |
| 2017 | $1,957 | $127,194 | $19,000 | $108,194 |
| 2016 | $1,779 | $130,560 | $19,000 | $111,560 |
| 2015 | $584 | $63,900 | $15,000 | $48,900 |
| 2014 | $584 | $63,900 | $15,000 | $48,900 |
Source: Public Records
Map
Nearby Homes
- 740 Shady Ln
- 1302 Woodridge Cir
- 705 Timbercreek Dr
- 4106 Hollow Oak Dr
- 1309 Driftwood Dr
- 42 Page St
- 808 Lee Dr
- 413 Wanda Way
- 803 Glenda Dr
- 832 Chateau Valee Cir
- 308 Wanda Way
- 802 Brown Trail
- 212 E Ellen Ave
- 552 Norwood Dr
- 860 Lee Dr
- 609 Norwood Dr
- 312 E Ellen Ave
- 260 Corinna Ct
- 933 Wade Dr
- 341 Hurst Dr
- 709 Tanglewood Dr
- 701 Tanglewood Dr
- 713 Tanglewood Dr
- 714 E Pecan St
- 708 E Pecan St
- 708 E Pecan St Unit 714
- 704 E Pecan St
- 700 E Pecan St
- 710 E Pecan St
- 722 E Pecan St
- 716 E Pecan St
- 716 E Pecan St Unit 722
- 716 E Pecan St Unit 16-722
- 717 Tanglewood Dr
- 708 Tanglewood Dr
- 700 Tanglewood Dr
- 718 E Pecan St
- 720 E Pecan St
- 712 Tanglewood Dr
- 728 E Pecan St
Your Personal Tour Guide
Ask me questions while you tour the home.