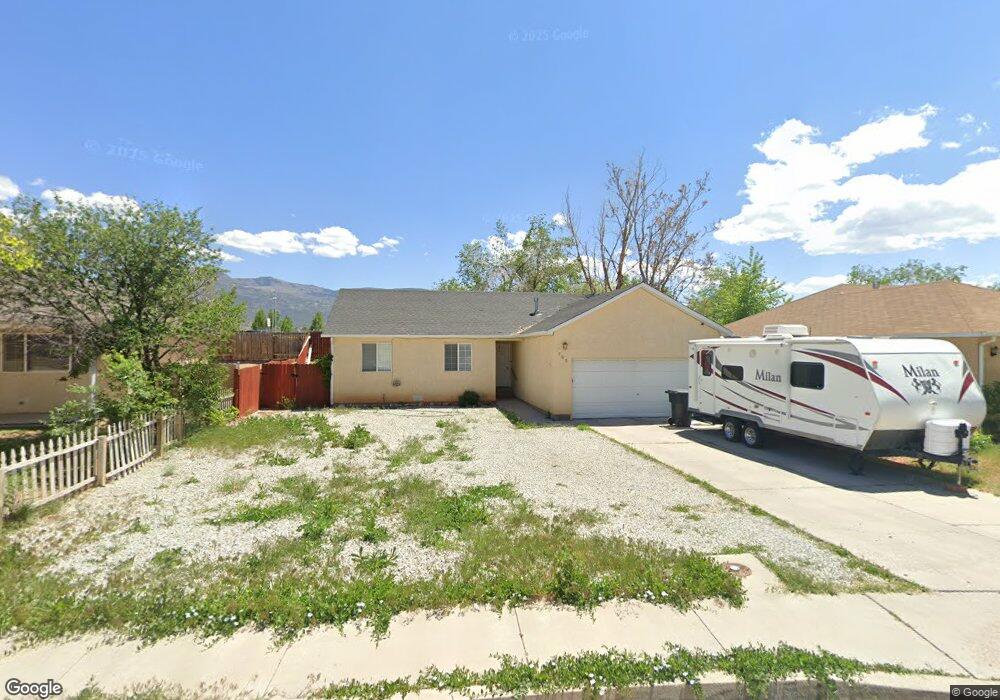
705 W 1050 N Cedar City, UT 84721
Estimated Value: $283,000 - $330,000
3
Beds
2
Baths
1,152
Sq Ft
$264/Sq Ft
Est. Value
About This Home
This home is located at 705 W 1050 N, Cedar City, UT 84721 and is currently estimated at $304,239, approximately $264 per square foot. 705 W 1050 N is a home located in Iron County with nearby schools including Three Peaks School, Canyon View Middle School, and Canyon View High School.
Ownership History
Date
Name
Owned For
Owner Type
Purchase Details
Closed on
Jun 22, 2021
Sold by
Jeramy Pearson
Bought by
Peterson Justin and Peterson Heather
Current Estimated Value
Home Financials for this Owner
Home Financials are based on the most recent Mortgage that was taken out on this home.
Original Mortgage
$230,519
Outstanding Balance
$208,706
Interest Rate
2.9%
Mortgage Type
FHA
Estimated Equity
$95,533
Purchase Details
Closed on
Aug 4, 2016
Sold by
Hendricks Laura
Bought by
Pearson Jeramy
Home Financials for this Owner
Home Financials are based on the most recent Mortgage that was taken out on this home.
Original Mortgage
$122,735
Interest Rate
3.75%
Mortgage Type
FHA
Purchase Details
Closed on
Mar 28, 2012
Sold by
Dawson Marcia
Bought by
Dawson Marcia and Hendricks Laura
Home Financials for this Owner
Home Financials are based on the most recent Mortgage that was taken out on this home.
Original Mortgage
$58,665
Interest Rate
3.83%
Mortgage Type
USDA
Create a Home Valuation Report for This Property
The Home Valuation Report is an in-depth analysis detailing your home's value as well as a comparison with similar homes in the area
Home Values in the Area
Average Home Value in this Area
Purchase History
| Date | Buyer | Sale Price | Title Company |
|---|---|---|---|
| Peterson Justin | -- | First American Title | |
| Pearson Jeramy | -- | First American Sugarhouse | |
| Dawson Marcia | -- | Southern Utah Title | |
| Dawson Marcia | -- | Utah Title |
Source: Public Records
Mortgage History
| Date | Status | Borrower | Loan Amount |
|---|---|---|---|
| Open | Peterson Justin | $230,519 | |
| Previous Owner | Pearson Jeramy | $122,735 | |
| Previous Owner | Dawson Marcia | $58,665 |
Source: Public Records
Tax History Compared to Growth
Tax History
| Year | Tax Paid | Tax Assessment Tax Assessment Total Assessment is a certain percentage of the fair market value that is determined by local assessors to be the total taxable value of land and additions on the property. | Land | Improvement |
|---|---|---|---|---|
| 2025 | $1,121 | $144,100 | $33,029 | $111,071 |
| 2023 | $1,209 | $150,435 | $36,700 | $113,735 |
| 2022 | $1,161 | $126,280 | $30,580 | $95,700 |
| 2021 | $838 | $91,125 | $14,560 | $76,565 |
| 2020 | $907 | $87,480 | $14,560 | $72,920 |
| 2019 | $911 | $84,010 | $14,560 | $69,450 |
| 2018 | $812 | $72,435 | $14,560 | $57,875 |
| 2017 | $747 | $65,665 | $10,245 | $55,420 |
| 2016 | $690 | $56,475 | $8,285 | $48,190 |
| 2015 | $661 | $51,270 | $0 | $0 |
| 2014 | $592 | $42,965 | $0 | $0 |
Source: Public Records
Map
Nearby Homes
- 698 W 1050 N
- 2770 W Rock Ridge Rd
- 576 W 1045 N Unit A17
- 780 W 1125 N Unit 46
- 780 W 1125 N Unit 23
- 780 W 1125 N Unit 22
- 971 Ironwood Cir
- 827 W 1175 N Unit 56
- 1222 N Cedar Blvd
- 1177 N Northfield Rd Unit 85
- 1177 N Northfield Rd Unit 66
- Lot 5 & 6 Cedar Valley Acres
- 1918 S Oak Springs Cir
- 404 W 1325 N Unit L-5
- 1365 N 650 W
- 1392 N 650 W
- 723 W 1050 N
- 685 W 1050 N
- 718 W 1050 N
- 745 W 1050 N
- 740 W 1050 N
- 665 W 1050 N
- 765 W 1050 N
- 676 W 1050 N
- 2802 W Rock Ridge Rd Unit 4
- 2770 W Rock Ridge Rd Unit 4
- 2802 W Rock Ridge Rd Unit (Lot 414)
- 2853 W Rock Ridge Rd
- 2865 W Rock Ridge Rd
- 2866 W Rock Ridge Rd Unit 419
- 1076 N 775 W
- 701 W North Cedar Blvd
- 1097 N Cedar Blvd
- 731 W North Cedar Blvd
- 773 W 1050 N
- 757 W North Cedar Blvd