Estimated Value: $247,000 - $303,000
3
Beds
2
Baths
1,903
Sq Ft
$144/Sq Ft
Est. Value
About This Home
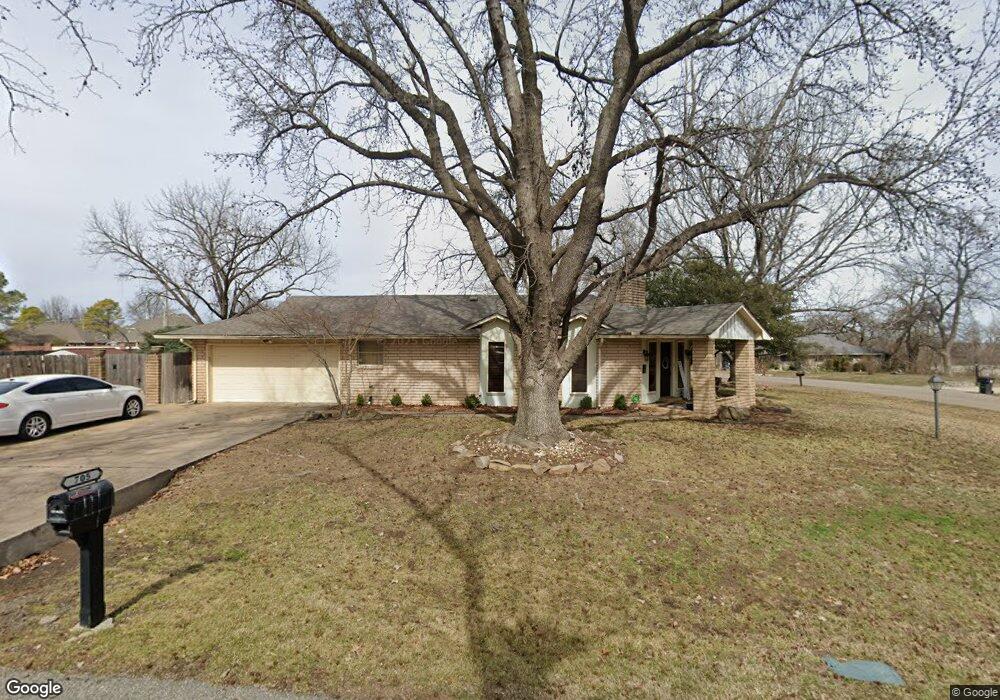
This home is located at 705 W 97th St S, Jenks, OK 74037 and is currently estimated at $274,374, approximately $144 per square foot. 705 W 97th St S is a home located in Tulsa County with nearby schools including Jenks West Elementary School, Jenks West Intermediate Elementary School, and Jenks Middle School.
Ownership History
Date
Name
Owned For
Owner Type
Purchase Details
Closed on
Jul 21, 2006
Sold by
Glenn Diane M and Glenn Stephen B
Bought by
Rider Preston D and Rider Jennifer L
Current Estimated Value
Purchase Details
Closed on
Apr 18, 2006
Sold by
Srl Investment Group Llc
Bought by
Glenn Diane M
Purchase Details
Closed on
Mar 4, 2005
Sold by
Murray Ronald W and Murray Susan J
Bought by
Srl Investment Group Llc
Home Financials for this Owner
Home Financials are based on the most recent Mortgage that was taken out on this home.
Original Mortgage
$109,500
Interest Rate
5.71%
Mortgage Type
Balloon
Purchase Details
Closed on
Jul 1, 1987
Create a Home Valuation Report for This Property
The Home Valuation Report is an in-depth analysis detailing your home's value as well as a comparison with similar homes in the area
Home Values in the Area
Average Home Value in this Area
Purchase History
| Date | Buyer | Sale Price | Title Company |
|---|---|---|---|
| Rider Preston D | $135,000 | None Available | |
| Glenn Diane M | -- | None Available | |
| Srl Investment Group Llc | $93,000 | Green Country Title & Escrow | |
| -- | $98,000 | -- |
Source: Public Records
Mortgage History
| Date | Status | Borrower | Loan Amount |
|---|---|---|---|
| Previous Owner | Srl Investment Group Llc | $109,500 |
Source: Public Records
Tax History Compared to Growth
Tax History
| Year | Tax Paid | Tax Assessment Tax Assessment Total Assessment is a certain percentage of the fair market value that is determined by local assessors to be the total taxable value of land and additions on the property. | Land | Improvement |
|---|---|---|---|---|
| 2024 | $2,235 | $19,917 | $2,311 | $17,606 |
| 2023 | $2,235 | $18,969 | $2,352 | $16,617 |
| 2022 | $2,125 | $18,066 | $3,152 | $14,914 |
| 2021 | $2,043 | $17,206 | $3,002 | $14,204 |
| 2020 | $1,998 | $16,865 | $2,942 | $13,923 |
| 2019 | $1,908 | $16,062 | $2,802 | $13,260 |
| 2018 | $1,906 | $16,062 | $2,802 | $13,260 |
| 2017 | $1,794 | $15,592 | $2,720 | $12,872 |
| 2016 | $1,735 | $14,850 | $2,684 | $12,166 |
| 2015 | $1,750 | $14,850 | $2,684 | $12,166 |
| 2014 | $1,764 | $14,850 | $2,684 | $12,166 |
Source: Public Records
Map
Nearby Homes
- 9726 S Houston Ave
- 2428 W C St
- 508 N Willow St
- 9402 S Elwood
- 2105 W F Ct
- 9340 S Elwood Ave
- 2102 W J St
- 2040 E 129th Place S
- 1410 W 91st St
- 8730 S Olympia Ave
- 8732 S Quanah Ave
- 908 W 86th Place S
- 1107 W 86th Place S
- 922 W 86th St S
- 1114 W 86th St S
- 1118 W 86th St S
- 8723 S Phoenix Place W
- 1105 W 86th St S
- 927 W J St
- 912 W 85th St
- 708 W 97th St S
- 9606 S Houston Ave
- 715 W 97th St S
- 9706 S Houston Ave
- 718 W 97th St S
- 9709 S Houston Ave
- 9605 S Houston Ave
- 725 W 97th St S
- 9716 S Houston Ave
- 0 S 97th St Unit 1929193
- 9611 S Houston Ave
- 728 W 97th St S
- 741 W 97th Place S
- 731 W 97th Place S
- 9719 S Houston Ave
- 2318 W C St
- 2314 W C St
- 2322 W C St
- 721 W 97th Place S
- 2310 W C St