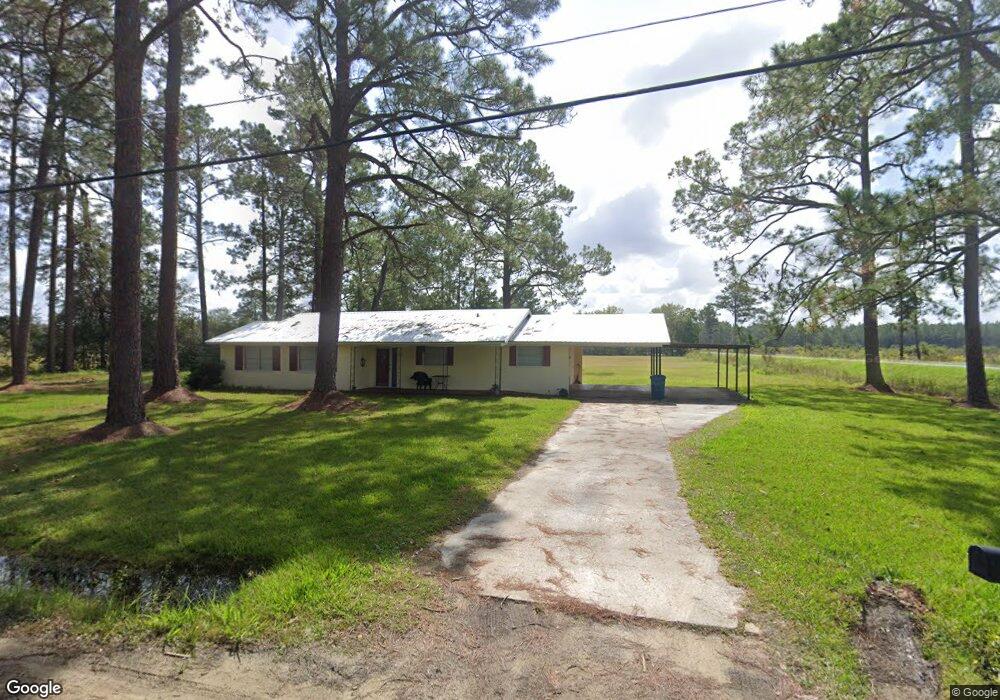
705 Walker Rd Waycross, GA 31503
Estimated Value: $130,000 - $267,000
--
Bed
2
Baths
1,621
Sq Ft
$111/Sq Ft
Est. Value
About This Home
This home is located at 705 Walker Rd, Waycross, GA 31503 and is currently estimated at $180,419, approximately $111 per square foot. 705 Walker Rd is a home located in Ware County with nearby schools including Memorial Drive Elementary School, Waycross Middle School, and Ware County High School.
Ownership History
Date
Name
Owned For
Owner Type
Purchase Details
Closed on
Jan 1, 2014
Sold by
Todman Taral J and Todman Casey D
Bought by
Audit Dept
Current Estimated Value
Purchase Details
Closed on
Dec 1, 2009
Sold by
Wild Charles M
Bought by
Todman Taral J and Todman Casey D
Home Financials for this Owner
Home Financials are based on the most recent Mortgage that was taken out on this home.
Original Mortgage
$91,716
Interest Rate
5.01%
Mortgage Type
New Conventional
Purchase Details
Closed on
Aug 8, 2008
Sold by
Johnson Jerry E
Bought by
Wild Charles M
Home Financials for this Owner
Home Financials are based on the most recent Mortgage that was taken out on this home.
Original Mortgage
$79,373
Interest Rate
6.32%
Mortgage Type
FHA
Purchase Details
Closed on
May 26, 2000
Sold by
Todd William and Todd Gail
Bought by
Johnson Jerry E
Create a Home Valuation Report for This Property
The Home Valuation Report is an in-depth analysis detailing your home's value as well as a comparison with similar homes in the area
Home Values in the Area
Average Home Value in this Area
Purchase History
| Date | Buyer | Sale Price | Title Company |
|---|---|---|---|
| Audit Dept | $69,100 | -- | |
| Todman Taral J | $89,900 | -- | |
| Wild Charles M | $80,000 | -- | |
| Johnson Jerry E | $300 | -- |
Source: Public Records
Mortgage History
| Date | Status | Borrower | Loan Amount |
|---|---|---|---|
| Previous Owner | Todman Taral J | $91,716 | |
| Previous Owner | Wild Charles M | $79,373 |
Source: Public Records
Tax History Compared to Growth
Tax History
| Year | Tax Paid | Tax Assessment Tax Assessment Total Assessment is a certain percentage of the fair market value that is determined by local assessors to be the total taxable value of land and additions on the property. | Land | Improvement |
|---|---|---|---|---|
| 2024 | $671 | $43,002 | $3,769 | $39,233 |
| 2023 | $685 | $38,856 | $3,506 | $35,350 |
| 2022 | $773 | $38,856 | $3,506 | $35,350 |
| 2021 | $764 | $29,087 | $2,697 | $26,390 |
| 2020 | $806 | $28,035 | $2,697 | $25,338 |
| 2019 | $787 | $26,984 | $2,697 | $24,287 |
| 2018 | $781 | $25,932 | $2,697 | $23,235 |
| 2017 | $780 | $25,932 | $2,697 | $23,235 |
| 2016 | $780 | $25,932 | $2,697 | $23,235 |
| 2015 | $802 | $26,356 | $3,121 | $23,235 |
| 2014 | $800 | $26,356 | $3,121 | $23,235 |
| 2013 | -- | $26,356 | $3,120 | $23,235 |
Source: Public Records
Map
Nearby Homes
- 2204 & 2210 Gibbs St
- 1808 Brunel St
- 201 Washington Ave
- 1500 Georgia Ave
- 0 Swamp Rd
- 0 Kentucky Ave
- 1304 Brunel St
- Tbd Old Shop Rd
- 1316 Blackwell St
- 0 Cabinet St
- 1721 Minnesota Ave
- 1021 Lee Ave
- 805 Brunel St
- 615 Morton Ave
- 1125 Georgia St
- 705 Gilmore St
- 00 Deergrass Ave
- 1103 Ann St
- 2475 Minnesota Ave
- 1208 Margaret St
- 705 Walker Rd
- 0 Gibbs St
- 601 Walker Rd
- 2310 Creswell St
- 2509 Gibbs St
- 2313 Creswell St
- 501 Walker Rd
- 2530 Gibbs St
- 2210 Creswell St
- 2312 Prescott St
- 2511 Gibbs St
- 2517 Gibbs St
- 2309 Prescott St
- 2203 Creswell St
- 2202 Creswell St
- 2202 Gibbs St
- 2115 Gibbs St
- 2201 Creswell St
- 2305 Prescott St
- 2303 Prescott St