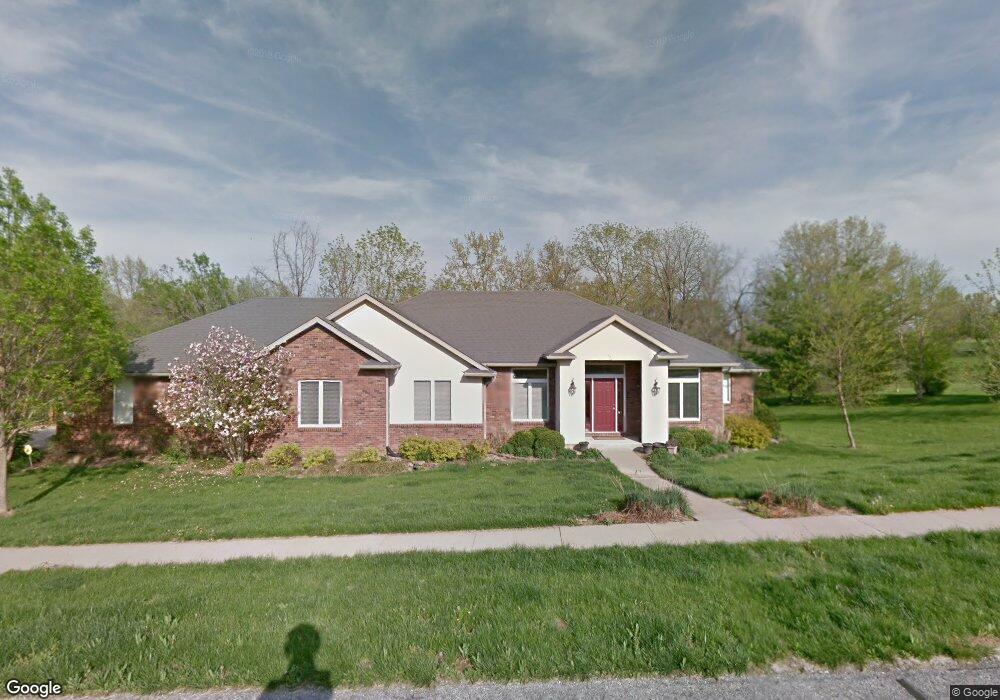
7050 Seminole Ct Columbia, MO 65203
Estimated Value: $476,000 - $549,000
5
Beds
3
Baths
3,361
Sq Ft
$153/Sq Ft
Est. Value
About This Home
This home is located at 7050 Seminole Ct, Columbia, MO 65203 and is currently estimated at $513,733, approximately $152 per square foot. 7050 Seminole Ct is a home located in Boone County with nearby schools including Beulah Ralph Elementary School, Ann Hawkins Gentry Middle School, and Rock Bridge High School.
Ownership History
Date
Name
Owned For
Owner Type
Purchase Details
Closed on
Apr 18, 2018
Sold by
Smolanovich Andrea
Bought by
Requarth Terrance J
Current Estimated Value
Purchase Details
Closed on
Apr 7, 2008
Sold by
Requarth Terrance J
Bought by
Requarth Terrance J and Smolanovich Andrea
Home Financials for this Owner
Home Financials are based on the most recent Mortgage that was taken out on this home.
Original Mortgage
$365,000
Interest Rate
5.88%
Mortgage Type
Purchase Money Mortgage
Purchase Details
Closed on
Feb 15, 2008
Sold by
Propes James R and Propes Deborah R
Bought by
Requarth Terrance J
Home Financials for this Owner
Home Financials are based on the most recent Mortgage that was taken out on this home.
Original Mortgage
$365,000
Interest Rate
5.88%
Mortgage Type
Purchase Money Mortgage
Purchase Details
Closed on
Feb 14, 2006
Sold by
Propes James R and Propes Deborah R
Bought by
Propes James R and Propes Deborah R
Create a Home Valuation Report for This Property
The Home Valuation Report is an in-depth analysis detailing your home's value as well as a comparison with similar homes in the area
Home Values in the Area
Average Home Value in this Area
Purchase History
| Date | Buyer | Sale Price | Title Company |
|---|---|---|---|
| Requarth Terrance J | -- | None Available | |
| Requarth Terrance J | -- | None Available | |
| Requarth Terrance J | -- | None Available | |
| Propes James R | -- | None Available |
Source: Public Records
Mortgage History
| Date | Status | Borrower | Loan Amount |
|---|---|---|---|
| Previous Owner | Requarth Terrance J | $365,000 |
Source: Public Records
Tax History Compared to Growth
Tax History
| Year | Tax Paid | Tax Assessment Tax Assessment Total Assessment is a certain percentage of the fair market value that is determined by local assessors to be the total taxable value of land and additions on the property. | Land | Improvement |
|---|---|---|---|---|
| 2025 | $4,317 | $65,664 | $9,975 | $55,689 |
| 2024 | $4,317 | $59,698 | $9,975 | $49,723 |
| 2023 | $4,280 | $59,698 | $9,975 | $49,723 |
| 2022 | $4,112 | $57,399 | $9,975 | $47,424 |
| 2021 | $4,119 | $57,399 | $9,975 | $47,424 |
| 2020 | $4,364 | $57,399 | $9,975 | $47,424 |
| 2019 | $4,364 | $57,399 | $9,975 | $47,424 |
| 2018 | $4,391 | $0 | $0 | $0 |
| 2017 | $4,341 | $57,399 | $9,975 | $47,424 |
| 2016 | $4,334 | $57,399 | $9,975 | $47,424 |
| 2015 | $4,003 | $57,399 | $9,975 | $47,424 |
| 2014 | $4,012 | $57,399 | $9,975 | $47,424 |
Source: Public Records
Map
Nearby Homes
- 3702 Timber Run Dr
- 6801 Montauk Ct
- 3985 W Shrubbery Ct
- 3995 W Shrubbery Ct
- TRACT 2B Old Plank Rd S
- 0 Lot 1005 Needle Rush Dr Unit 420353
- TR 2 W Route K
- 7259 Brackenhill Ct
- 7590 S R A Nursery Rd
- 3108 Timber Run Dr
- 7405 Brackenhill Dr
- Lot 3 Arrowhead Lake Dr
- LOT 1 & 2 W Old Plank Road (Barcus Ridge) Rd
- 3001 Rivington Dr
- 7200 Rudchester Ct
- 7333 Sella Ct
- 6245 S Arrowhead Lake Dr
- 7510 Kirby Knowle Ct
- 7100 Madison Creek Dr
- LOT 102 S Warren School Rd
- 7051 Seminole Ct
- 7110 Seminole Ct
- 7001 Seminole Ct
- 7000 Seminole Ct
- 3805 Timber Run Dr
- 3803 Timber Run Dr
- 7121 Seminole Ct
- 3807 Timber Run Dr
- LOT #20 Timber Run
- LOT 20 Timber Run Dr
- 3801 Timber Run Dr
- LOT 20 Timber Run
- 3809 Timber Run Dr
- L 21 Timber Run Dr
- 3711 Timber Run Dr
- 6957 Seminole Ct
- 3811 Timber Run Dr
- 3709 Timber Run Dr
- L 22 Timber Run Dr
- 6950 Seminole Ct