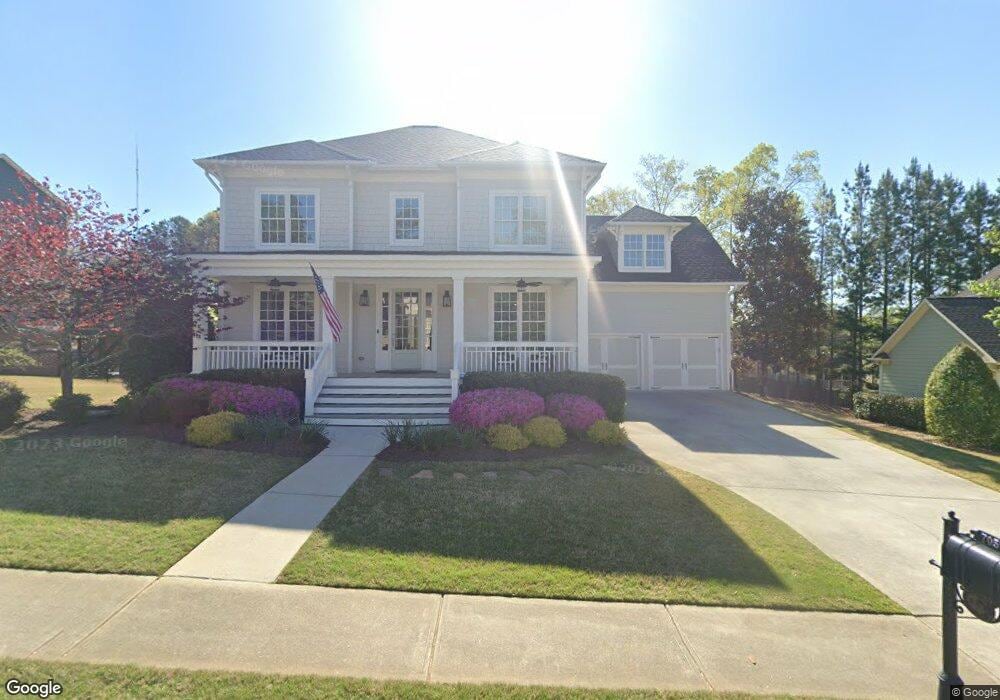
7051 Dove Point Ln Hoschton, GA 30548
Estimated Value: $704,000 - $775,270
6
Beds
5
Baths
5,758
Sq Ft
$127/Sq Ft
Est. Value
About This Home
This home is located at 7051 Dove Point Ln, Hoschton, GA 30548 and is currently estimated at $731,318, approximately $127 per square foot. 7051 Dove Point Ln is a home located in Hall County with nearby schools including Spout Springs Elementary School, Cherokee Bluff Middle School, and Cherokee Bluff High School.
Ownership History
Date
Name
Owned For
Owner Type
Purchase Details
Closed on
Nov 18, 2019
Sold by
Griffin Michael D
Bought by
Staples Jay T and Staples Rachel F
Current Estimated Value
Home Financials for this Owner
Home Financials are based on the most recent Mortgage that was taken out on this home.
Original Mortgage
$285,000
Outstanding Balance
$248,384
Interest Rate
3.6%
Mortgage Type
New Conventional
Estimated Equity
$482,934
Purchase Details
Closed on
Dec 21, 2012
Sold by
Griffin Constance L
Bought by
Griffin Michael D
Purchase Details
Closed on
Oct 16, 2008
Sold by
Griffin Michael D
Bought by
Griffin Michael D and Griffin Constance L
Home Financials for this Owner
Home Financials are based on the most recent Mortgage that was taken out on this home.
Original Mortgage
$360,600
Interest Rate
5.96%
Mortgage Type
New Conventional
Create a Home Valuation Report for This Property
The Home Valuation Report is an in-depth analysis detailing your home's value as well as a comparison with similar homes in the area
Home Values in the Area
Average Home Value in this Area
Purchase History
| Date | Buyer | Sale Price | Title Company |
|---|---|---|---|
| Staples Jay T | $440,000 | -- | |
| Griffin Michael D | -- | -- | |
| Griffin Michael D | -- | -- | |
| Griffin Michael D | $372,100 | -- |
Source: Public Records
Mortgage History
| Date | Status | Borrower | Loan Amount |
|---|---|---|---|
| Open | Staples Jay T | $285,000 | |
| Previous Owner | Griffin Michael D | $360,600 |
Source: Public Records
Tax History Compared to Growth
Tax History
| Year | Tax Paid | Tax Assessment Tax Assessment Total Assessment is a certain percentage of the fair market value that is determined by local assessors to be the total taxable value of land and additions on the property. | Land | Improvement |
|---|---|---|---|---|
| 2024 | $5,744 | $229,200 | $44,840 | $184,360 |
| 2023 | $4,659 | $239,720 | $38,360 | $201,360 |
| 2022 | $5,261 | $201,080 | $38,000 | $163,080 |
| 2021 | $4,883 | $183,120 | $30,160 | $152,960 |
| 2020 | $3,847 | $164,080 | $23,680 | $140,400 |
| 2019 | $4,925 | $209,240 | $35,520 | $173,720 |
| 2018 | $5,480 | $191,840 | $21,520 | $170,320 |
| 2017 | $5,085 | $179,720 | $21,520 | $158,200 |
| 2016 | $4,422 | $159,800 | $21,520 | $138,280 |
| 2015 | $4,275 | $159,800 | $21,520 | $138,280 |
| 2014 | $4,275 | $153,280 | $21,520 | $131,760 |
Source: Public Records
Map
Nearby Homes
- 7206 Grand Reunion Dr
- 7207 Spout Springs Rd
- 7208 Ivey Leaf Ln
- 7231 Grand Reunion Dr
- 6021 Ash Hill Place
- 7144 Maple Brook Ln
- 6001 Ash Hill Place
- 7164 Maple Brook Ln
- 7289 Mulberry Trace Ln Unit LOT 178
- 7296 Mulberry Trace Ln Unit LOT 180
- 7296 Mulberry Trace Ln
- 7300 Mulberry Trace Ln
- 7300 Mulberry Trace Ln Unit LOT 181
- 7304 Mulberry Trace Ln Unit LOT 182
- 7304 Mulberry Trace Ln
- 7308 Mulberry Trace Ln Unit LOT 183
- 7308 Mulberry Trace Ln
- 7312 Mulberry Trace Ln Unit LOT 184
- 7312 Mulberry Trace Ln
- 7316 Mulberry Trace Ln
- 7045 Dove Point Ln
- 7057 Dove Point Ln
- 7180 Wrights Ln
- 7180 Wrights Ln
- 7184 Wrights Ln Unit 1037
- 7184 Wrights Ln
- 7039 Dove Point Ln
- 7052 Dove Point Ln
- 7048 Dove Point Ln
- 7176 Wrights Ln
- 7044 Dove Point Ln
- 7188 Wrights Ln
- 7188 Wrights Ln
- 0 Dove Point Ln Unit 8697177
- 0 Dove Point Ln Unit 8569402
- 0 Dove Point Ln Unit 8256723
- 0 Dove Point Ln Unit 8590384
- 0 Dove Point Ln Unit 8820040
- 0 Dove Point Ln Unit 7296211
- 0 Dove Point Ln