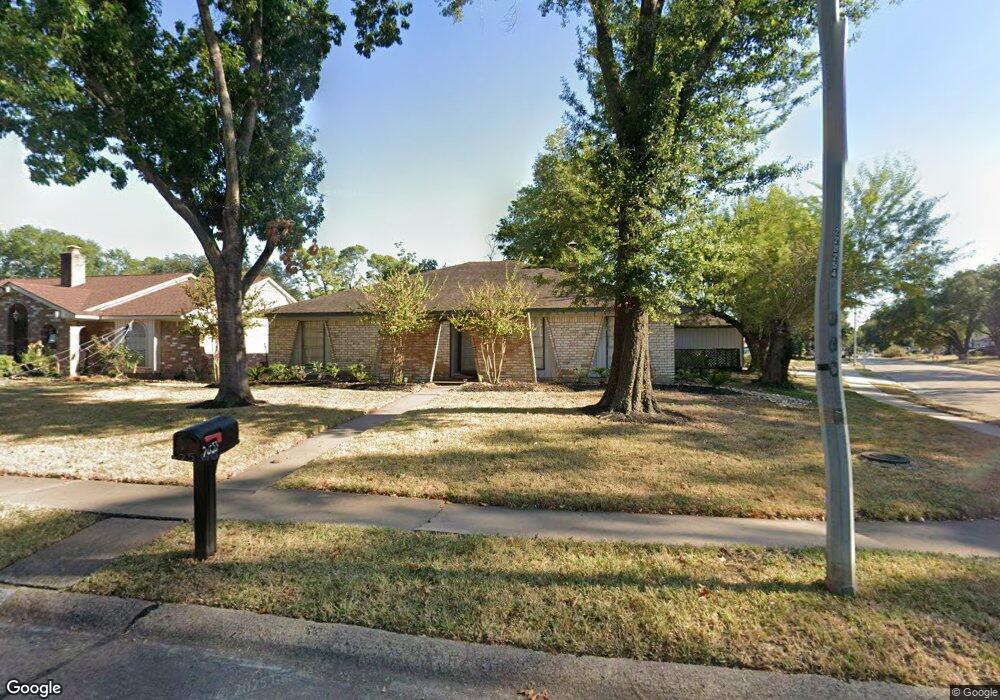
7051 Woodfern Dr Houston, TX 77040
Greater Inwood NeighborhoodEstimated Value: $251,000 - $264,000
3
Beds
2
Baths
1,979
Sq Ft
$130/Sq Ft
Est. Value
About This Home
This home is located at 7051 Woodfern Dr, Houston, TX 77040 and is currently estimated at $256,877, approximately $129 per square foot. 7051 Woodfern Dr is a home located in Harris County with nearby schools including Holbrook Elementary School, Dean Middle School, and Jersey Village High School.
Ownership History
Date
Name
Owned For
Owner Type
Purchase Details
Closed on
Dec 11, 2009
Sold by
Realwealth Inc
Bought by
Jimenez Cesar and Luna Maria Magdalena
Current Estimated Value
Home Financials for this Owner
Home Financials are based on the most recent Mortgage that was taken out on this home.
Original Mortgage
$112,818
Outstanding Balance
$74,001
Interest Rate
5.01%
Mortgage Type
FHA
Estimated Equity
$182,876
Purchase Details
Closed on
Aug 19, 2009
Sold by
Abshire Constance Haynes
Bought by
Realwealth Inc
Home Financials for this Owner
Home Financials are based on the most recent Mortgage that was taken out on this home.
Original Mortgage
$71,500
Interest Rate
5.19%
Mortgage Type
Purchase Money Mortgage
Purchase Details
Closed on
Feb 1, 2006
Sold by
Abshire Constance Haynes
Bought by
Abshire Constance Haynes and The Raymond Haynes Sr Supplemental Care
Purchase Details
Closed on
Dec 29, 2005
Sold by
Haynes Raymond
Bought by
Abshire Constance Haynes
Create a Home Valuation Report for This Property
The Home Valuation Report is an in-depth analysis detailing your home's value as well as a comparison with similar homes in the area
Home Values in the Area
Average Home Value in this Area
Purchase History
| Date | Buyer | Sale Price | Title Company |
|---|---|---|---|
| Jimenez Cesar | -- | Star Tex Title Company 04 | |
| Realwealth Inc | -- | Multiple | |
| Abshire Constance Haynes | -- | None Available | |
| Abshire Constance Haynes | -- | None Available |
Source: Public Records
Mortgage History
| Date | Status | Borrower | Loan Amount |
|---|---|---|---|
| Open | Jimenez Cesar | $112,818 | |
| Previous Owner | Realwealth Inc | $71,500 |
Source: Public Records
Tax History Compared to Growth
Tax History
| Year | Tax Paid | Tax Assessment Tax Assessment Total Assessment is a certain percentage of the fair market value that is determined by local assessors to be the total taxable value of land and additions on the property. | Land | Improvement |
|---|---|---|---|---|
| 2025 | $3,297 | $223,203 | $61,993 | $161,210 |
| 2024 | $3,297 | $234,333 | $61,993 | $172,340 |
| 2023 | $3,297 | $232,322 | $61,993 | $170,329 |
| 2022 | $2,455 | $208,602 | $51,771 | $156,831 |
| 2021 | $4,446 | $172,052 | $51,771 | $120,281 |
| 2020 | $4,703 | $176,625 | $36,350 | $140,275 |
| 2019 | $4,310 | $155,540 | $21,810 | $133,730 |
| 2018 | $1,983 | $137,717 | $21,810 | $115,907 |
| 2017 | $3,814 | $137,717 | $21,810 | $115,907 |
| 2016 | $3,814 | $137,717 | $21,810 | $115,907 |
| 2015 | $3,142 | $130,506 | $18,175 | $112,331 |
| 2014 | $3,142 | $111,623 | $18,175 | $93,448 |
Source: Public Records
Map
Nearby Homes
- 7218 Stonegate Dr
- 7259 Shady Arbor Ln
- 7318 Shady Grove Ln
- 6902 Anson Point Ln
- 8615 Black Tern Ln
- 9350 Guywood St
- 8610 Twillingate Ln
- 6407 Deirdre Anne Dr
- 9331 Deanwood St
- 7051 Majestic Oaks Dr
- 6310 Silver Chalice Dr
- 9523 Vanwood St
- 6430 Pirtlewood Cir
- 6338 Maple Hill Dr
- 7718 Breezeway St
- 7218 Jadewood Dr Unit 770
- 9515 Summer Laurel Ln
- 7219 Ridge Oak Dr
- 9519 Summer Laurel Ln
- 6311 Fairwood Dr
- 7047 Woodfern Dr
- 9018 Stone Brook Ln
- 7043 Woodfern Dr
- 9023 Stone Brook Ln
- 9014 Stone Brook Ln
- 7030 Hidden Arbor Ln
- 9019 Stone Brook Ln
- 7054 Woodfern Dr
- 7050 Woodfern Dr
- 7039 Woodfern Dr
- 7102 Woodfern Dr
- 7046 Woodfern Dr
- 9010 Stone Brook Ln
- 7026 Hidden Arbor Ln
- 7106 Woodfern Dr
- 7042 Woodfern Dr
- 7027 Hidden Arbor Ln
- 7035 Woodfern Dr
- 9018 Arbor Wood Dr
- 9011 Stone Brook Ln