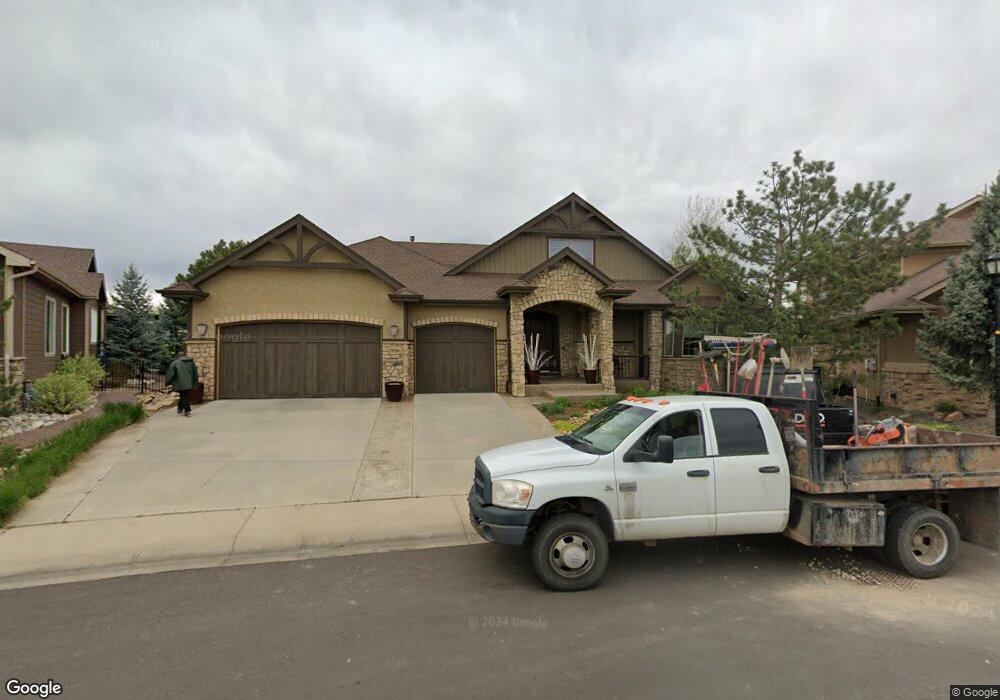
7054 Spanish Bay Dr Windsor, CO 80550
Estimated Value: $1,149,000 - $1,521,000
3
Beds
6
Baths
5,140
Sq Ft
$267/Sq Ft
Est. Value
About This Home
This home is located at 7054 Spanish Bay Dr, Windsor, CO 80550 and is currently estimated at $1,374,090, approximately $267 per square foot. 7054 Spanish Bay Dr is a home located in Larimer County with nearby schools including Colorado Early Colleges Windsor, Westgate KinderCare, and Resurrection Christian School.
Ownership History
Date
Name
Owned For
Owner Type
Purchase Details
Closed on
Nov 8, 2016
Sold by
Holcomb Kellie A and Sponberg Steven T
Bought by
Sponberg Kellie A and Sponberg Steven T
Current Estimated Value
Home Financials for this Owner
Home Financials are based on the most recent Mortgage that was taken out on this home.
Original Mortgage
$756,000
Outstanding Balance
$358,139
Interest Rate
3.42%
Mortgage Type
New Conventional
Estimated Equity
$1,015,951
Purchase Details
Closed on
Jan 11, 2007
Sold by
Custom On Site Builders Inc
Bought by
Holcomb Kellie A and Sponberg Steven T
Home Financials for this Owner
Home Financials are based on the most recent Mortgage that was taken out on this home.
Original Mortgage
$50,000
Interest Rate
6.09%
Mortgage Type
Unknown
Purchase Details
Closed on
Jul 7, 2006
Sold by
Country Farms Llc
Bought by
Custom On Site Builders Inc
Create a Home Valuation Report for This Property
The Home Valuation Report is an in-depth analysis detailing your home's value as well as a comparison with similar homes in the area
Home Values in the Area
Average Home Value in this Area
Purchase History
| Date | Buyer | Sale Price | Title Company |
|---|---|---|---|
| Sponberg Kellie A | -- | Fidelity National Title | |
| Holcomb Kellie A | $831,565 | Fahtco | |
| Custom On Site Builders Inc | $115,000 | None Available |
Source: Public Records
Mortgage History
| Date | Status | Borrower | Loan Amount |
|---|---|---|---|
| Open | Sponberg Kellie A | $756,000 | |
| Closed | Holcomb Kellie A | $50,000 | |
| Closed | Holcomb Kellie A | $567,000 |
Source: Public Records
Tax History Compared to Growth
Tax History
| Year | Tax Paid | Tax Assessment Tax Assessment Total Assessment is a certain percentage of the fair market value that is determined by local assessors to be the total taxable value of land and additions on the property. | Land | Improvement |
|---|---|---|---|---|
| 2025 | $12,777 | $89,224 | $20,904 | $68,320 |
| 2024 | $12,383 | $89,224 | $20,904 | $68,320 |
| 2022 | $10,086 | $69,292 | $15,158 | $54,134 |
| 2021 | $10,232 | $71,285 | $15,594 | $55,691 |
| 2020 | $10,948 | $75,804 | $11,440 | $64,364 |
| 2019 | $10,976 | $75,804 | $11,440 | $64,364 |
| 2018 | $9,398 | $68,342 | $10,634 | $57,708 |
| 2017 | $9,387 | $68,342 | $10,634 | $57,708 |
| 2016 | $10,214 | $74,100 | $9,154 | $64,946 |
| 2015 | $10,128 | $74,100 | $9,150 | $64,950 |
| 2014 | $8,460 | $61,350 | $7,160 | $54,190 |
Source: Public Records
Map
Nearby Homes
- 6682 Crooked Stick Dr
- 6787 Spanish Bay Dr
- 6511 Crooked Stick Dr
- 6408 Sanctuary Dr
- 6558 Murano Dr
- 6325 Sanctuary Dr
- 6671 Spanish Bay Dr
- 8264 Scenic Ridge Ct
- 8269 Park Hill Ct
- 6634 Crystal Downs Dr Unit 103
- 5375 Trade Wind Ct
- 6618 Crystal Downs Dr Unit 201
- 5936 Highland Hills Cir
- 6535 Half Moon Bay Dr
- 6690 Crystal Downs Dr Unit 205
- 6582 Crystal Downs Dr Unit 102
- 6510 Crystal Downs Dr Unit 206
- 6510 Crystal Downs Dr Unit 202
- 6228 Vernazza Way Unit 3
- 6228 Vernazza Way Unit 2
- 7042 Spanish Bay Dr
- 7060 Spanish Bay Dr
- 7038 Spanish Bay Dr
- 7057 Spanish Bay Dr
- 7078 Spanish Bay Dr
- 7041 Spanish Bay Dr
- 7020 Spanish Bay Dr
- 7084 Spanish Bay Dr
- 7089 Spanish Bay Dr
- 7023 Spanish Bay Dr
- 7004 Spanish Bay Dr
- 7112 Spanish Bay Dr
- 7115 Spanish Bay Dr
- 7017 Spanish Bay Dr
- 7011 Spanish Bay Dr
- 7163 Spanish Bay Dr
- 7150 Spanish Bay Dr
- 6780 Crooked Stick Dr Unit Crooked stick dr
- 6780 Crooked Stick Dr
- 7199 Spanish Bay Dr