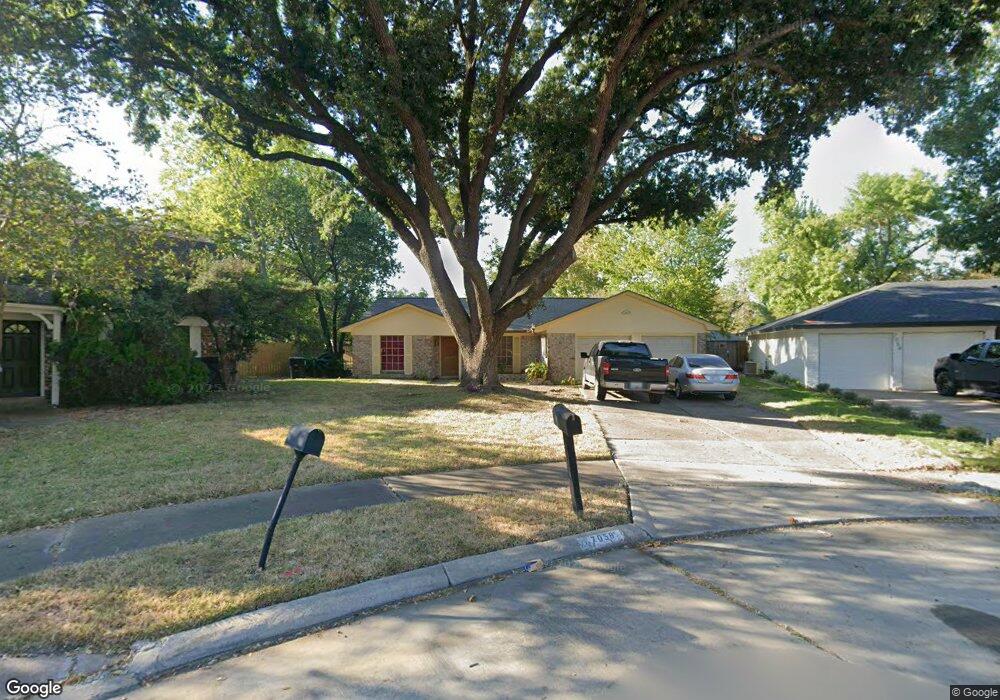
7058 Shady Arbor Ln Houston, TX 77040
Greater Inwood NeighborhoodEstimated Value: $234,534 - $250,000
3
Beds
2
Baths
1,734
Sq Ft
$139/Sq Ft
Est. Value
About This Home
This home is located at 7058 Shady Arbor Ln, Houston, TX 77040 and is currently estimated at $240,384, approximately $138 per square foot. 7058 Shady Arbor Ln is a home located in Harris County with nearby schools including Holbrook Elementary School, Dean Middle School, and Jersey Village High School.
Ownership History
Date
Name
Owned For
Owner Type
Purchase Details
Closed on
Oct 1, 2025
Sold by
Kolar Patrick Thomas
Bought by
Pullum Devon Allen
Current Estimated Value
Purchase Details
Closed on
Aug 30, 2002
Sold by
Hud
Bought by
Kolar Julie J
Home Financials for this Owner
Home Financials are based on the most recent Mortgage that was taken out on this home.
Original Mortgage
$61,746
Interest Rate
6.33%
Mortgage Type
Purchase Money Mortgage
Purchase Details
Closed on
Apr 26, 2002
Sold by
Chase Manhattan Mtg Corp
Bought by
Hud
Purchase Details
Closed on
Oct 18, 1999
Sold by
Sarabia Dominic J and Sababia Yvonne C
Bought by
Chase Manhattan Mtg Corp
Home Financials for this Owner
Home Financials are based on the most recent Mortgage that was taken out on this home.
Original Mortgage
$86,894
Interest Rate
7.9%
Mortgage Type
FHA
Create a Home Valuation Report for This Property
The Home Valuation Report is an in-depth analysis detailing your home's value as well as a comparison with similar homes in the area
Home Values in the Area
Average Home Value in this Area
Purchase History
| Date | Buyer | Sale Price | Title Company |
|---|---|---|---|
| Pullum Devon Allen | -- | None Listed On Document | |
| Kolar Julie J | -- | First American Title | |
| Hud | -- | Alamo Title Company | |
| Chase Manhattan Mtg Corp | $92,682 | -- | |
| Sarabia Dominic J | -- | Stewart Title |
Source: Public Records
Mortgage History
| Date | Status | Borrower | Loan Amount |
|---|---|---|---|
| Previous Owner | Kolar Julie J | $61,746 | |
| Previous Owner | Sarabia Dominic J | $86,894 | |
| Closed | Kolar Julie J | $15,437 |
Source: Public Records
Tax History Compared to Growth
Tax History
| Year | Tax Paid | Tax Assessment Tax Assessment Total Assessment is a certain percentage of the fair market value that is determined by local assessors to be the total taxable value of land and additions on the property. | Land | Improvement |
|---|---|---|---|---|
| 2025 | $91 | $209,991 | $65,518 | $144,473 |
| 2024 | $91 | $220,346 | $65,518 | $154,828 |
| 2023 | $91 | $218,479 | $65,518 | $152,961 |
| 2022 | $4,325 | $194,904 | $54,715 | $140,189 |
| 2021 | $4,111 | $159,089 | $54,715 | $104,374 |
| 2020 | $4,064 | $162,896 | $38,225 | $124,671 |
| 2019 | $3,845 | $142,614 | $22,935 | $119,679 |
| 2018 | $1,093 | $126,146 | $22,935 | $103,211 |
| 2017 | $3,493 | $126,146 | $22,935 | $103,211 |
| 2016 | $3,356 | $126,146 | $22,935 | $103,211 |
| 2015 | $2,056 | $117,307 | $19,113 | $98,194 |
| 2014 | $2,056 | $100,160 | $19,113 | $81,047 |
Source: Public Records
Map
Nearby Homes
- 7318 Shady Grove Ln
- 7259 Shady Arbor Ln
- 9350 Guywood St
- 7218 Stonegate Dr
- 6902 Anson Point Ln
- 8615 Black Tern Ln
- 9331 Deanwood St
- 6407 Deirdre Anne Dr
- 7051 Majestic Oaks Dr
- 8610 Twillingate Ln
- 9523 Vanwood St
- 6310 Silver Chalice Dr
- 6430 Pirtlewood Cir
- 7718 Breezeway St
- 9515 Summer Laurel Ln
- 9519 Summer Laurel Ln
- 6338 Maple Hill Dr
- 7218 Jadewood Dr Unit 770
- 7219 Ridge Oak Dr
- 9207 Loren Ln
- 7062 Shady Arbor Ln
- 7054 Shady Arbor Ln
- 7119 Shady Moss Ln
- 7115 Shady Moss Ln
- 7106 Shady Arbor Ln
- 7050 Shady Arbor Ln
- 7063 Shady Arbor Ln
- 7102 Shady Arbor Ln
- 7123 Shady Moss Ln
- 7110 Shady Arbor Ln
- 7111 Shady Moss Ln
- 7018 Shady Arbor Ln
- 7127 Shady Moss Ln
- 7103 Shady Arbor Ln
- 7014 Shady Arbor Ln
- 7107 Shady Moss Ln
- 7131 Shady Moss Ln
- 7059 Shady Arbor Ln
- 7114 Shady Arbor Ln
- 7010 Shady Arbor Ln