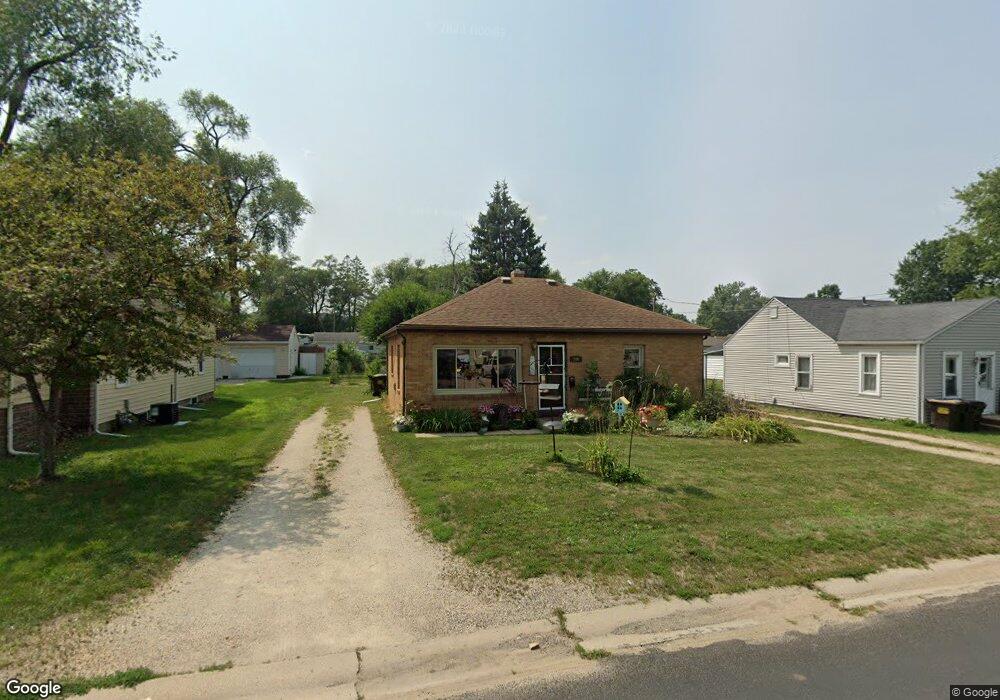
706 5th Ave Rock Falls, IL 61071
Estimated Value: $89,083 - $124,000
2
Beds
8
Baths
900
Sq Ft
$118/Sq Ft
Est. Value
About This Home
This home is located at 706 5th Ave, Rock Falls, IL 61071 and is currently estimated at $106,021, approximately $117 per square foot. 706 5th Ave is a home located in Whiteside County with nearby schools including Merrill Elementary School, Dillon Elementary School, and Rock Falls Middle School.
Ownership History
Date
Name
Owned For
Owner Type
Purchase Details
Closed on
Mar 3, 2008
Sold by
Hasenyager Michael K
Bought by
Martinez Pamela J
Current Estimated Value
Home Financials for this Owner
Home Financials are based on the most recent Mortgage that was taken out on this home.
Original Mortgage
$60,954
Outstanding Balance
$37,502
Interest Rate
5.51%
Mortgage Type
FHA
Estimated Equity
$68,519
Create a Home Valuation Report for This Property
The Home Valuation Report is an in-depth analysis detailing your home's value as well as a comparison with similar homes in the area
Home Values in the Area
Average Home Value in this Area
Purchase History
| Date | Buyer | Sale Price | Title Company |
|---|---|---|---|
| Martinez Pamela J | $61,500 | None Available |
Source: Public Records
Mortgage History
| Date | Status | Borrower | Loan Amount |
|---|---|---|---|
| Open | Martinez Pamela J | $60,954 |
Source: Public Records
Tax History
| Year | Tax Paid | Tax Assessment Tax Assessment Total Assessment is a certain percentage of the fair market value that is determined by local assessors to be the total taxable value of land and additions on the property. | Land | Improvement |
|---|---|---|---|---|
| 2024 | $2,365 | $27,565 | $4,627 | $22,938 |
| 2023 | $2,179 | $25,422 | $4,267 | $21,155 |
| 2022 | $2,020 | $23,469 | $4,023 | $19,446 |
| 2021 | $1,787 | $21,203 | $3,806 | $17,397 |
| 2020 | $1,777 | $20,840 | $3,741 | $17,099 |
| 2019 | $1,657 | $20,094 | $3,607 | $16,487 |
| 2018 | $1,535 | $19,646 | $3,527 | $16,119 |
| 2017 | $1,521 | $19,278 | $3,461 | $15,817 |
| 2016 | $1,482 | $18,954 | $3,403 | $15,551 |
| 2015 | $149 | $19,909 | $3,574 | $16,335 |
| 2014 | $1,471 | $19,378 | $3,479 | $15,899 |
| 2013 | $149 | $19,909 | $3,574 | $16,335 |
Source: Public Records
Map
Nearby Homes
Your Personal Tour Guide
Ask me questions while you tour the home.