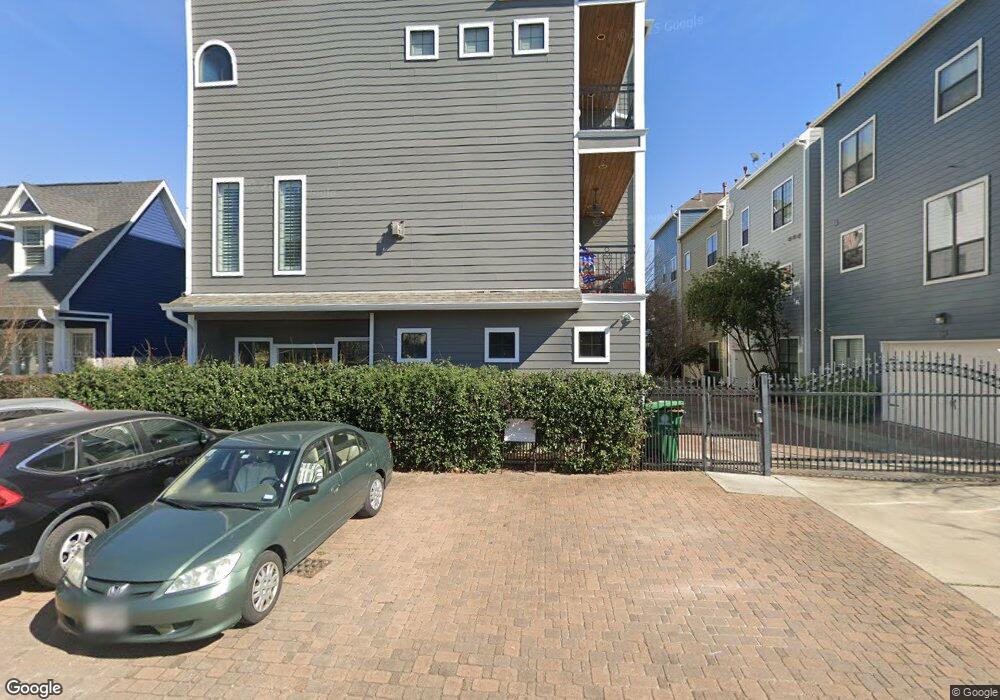
706 Allston St Houston, TX 77007
Greater Heights NeighborhoodEstimated Value: $666,000 - $907,000
4
Beds
4
Baths
2,895
Sq Ft
$262/Sq Ft
Est. Value
About This Home
This home is located at 706 Allston St, Houston, TX 77007 and is currently estimated at $758,139, approximately $261 per square foot. 706 Allston St is a home located in Harris County with nearby schools including Harvard Elementary School, Hogg Middle, and Heights High School.
Ownership History
Date
Name
Owned For
Owner Type
Purchase Details
Closed on
Dec 15, 2023
Sold by
Asbell Jason
Bought by
Sand Andrew Ceejay and Xu Cassie
Current Estimated Value
Home Financials for this Owner
Home Financials are based on the most recent Mortgage that was taken out on this home.
Original Mortgage
$445,500
Outstanding Balance
$438,466
Interest Rate
7.76%
Mortgage Type
VA
Estimated Equity
$319,673
Purchase Details
Closed on
Sep 30, 2009
Sold by
Manco Associates Lc
Bought by
Asbell Jason and Navarro Melissa
Home Financials for this Owner
Home Financials are based on the most recent Mortgage that was taken out on this home.
Original Mortgage
$300,000
Interest Rate
5.12%
Mortgage Type
New Conventional
Purchase Details
Closed on
Oct 18, 2006
Sold by
Tucker James M
Bought by
Manco Associates Lp
Purchase Details
Closed on
Jun 7, 2006
Sold by
Mullenix Elmer L
Bought by
Tucker James M
Purchase Details
Closed on
Feb 10, 2006
Sold by
Mullenix Donna R
Bought by
Mullenix Elmer L
Create a Home Valuation Report for This Property
The Home Valuation Report is an in-depth analysis detailing your home's value as well as a comparison with similar homes in the area
Home Values in the Area
Average Home Value in this Area
Purchase History
| Date | Buyer | Sale Price | Title Company |
|---|---|---|---|
| Sand Andrew Ceejay | -- | None Listed On Document | |
| Asbell Jason | -- | Pinnacle Title Co Lp | |
| Manco Associates Lc | -- | Pinnacle Title Co Lp | |
| Manco Associates Lp | -- | American Title Co | |
| Tucker James M | -- | American Title Co | |
| Mullenix Elmer L | -- | None Available |
Source: Public Records
Mortgage History
| Date | Status | Borrower | Loan Amount |
|---|---|---|---|
| Open | Sand Andrew Ceejay | $445,500 | |
| Previous Owner | Asbell Jason | $300,000 |
Source: Public Records
Tax History Compared to Growth
Tax History
| Year | Tax Paid | Tax Assessment Tax Assessment Total Assessment is a certain percentage of the fair market value that is determined by local assessors to be the total taxable value of land and additions on the property. | Land | Improvement |
|---|---|---|---|---|
| 2025 | $13,726 | $680,620 | $187,200 | $493,420 |
| 2024 | $13,726 | $655,993 | $187,200 | $468,793 |
| 2023 | $13,726 | $600,510 | $187,200 | $413,310 |
| 2022 | $10,975 | $498,438 | $140,400 | $358,038 |
| 2021 | $11,891 | $510,183 | $134,784 | $375,399 |
| 2020 | $11,875 | $490,400 | $140,400 | $350,000 |
| 2019 | $11,290 | $446,151 | $140,400 | $305,751 |
| 2018 | $9,244 | $469,231 | $131,040 | $338,191 |
| 2017 | $11,865 | $469,231 | $131,040 | $338,191 |
| 2016 | $12,116 | $494,795 | $145,454 | $349,341 |
| 2015 | $8,007 | $494,795 | $145,454 | $349,341 |
| 2014 | $8,007 | $457,394 | $124,675 | $332,719 |
Source: Public Records
Map
Nearby Homes
- 224 W 8th St
- 311 W 6th St
- 811 Yale St
- 805 Heights Blvd
- 809 Heights Blvd
- 836 Allston St
- 513 W 8th St
- 826 Heights Blvd
- 710 Waverly St Unit D
- 710 Waverly St Unit C
- 220 E 8th St
- 806 Waverly St
- 912 Heights Blvd
- 913 Tulane St
- 953 Yale St Unit 1
- 815 Arlington St
- 919 Ashland St Unit B
- 844 Cortlandt St
- 535 Arlington St
- 319 W 10th St
- 706 Allston St Unit C
- 706 Allston St Unit B
- 706 Allston St Unit A
- 706 Allston St Unit D
- 706B Allston St
- 704 Allston St Unit D
- 704 Allston St Unit A
- 704 Allston St Unit B
- 704 Allston St Unit C
- 704 Allston St
- 710 Allston St
- 704 Allston St
- 724 Allston St
- 726 Allston St
- 707 Allston St
- 626 Lot 4 Allston St
- 626 Lot 1 Allston St
- 725 Allston St
- 730 Allston St
- 711 Allston St