Estimated Value: $256,000 - $313,000
4
Beds
3
Baths
1,341
Sq Ft
$217/Sq Ft
Est. Value
About This Home
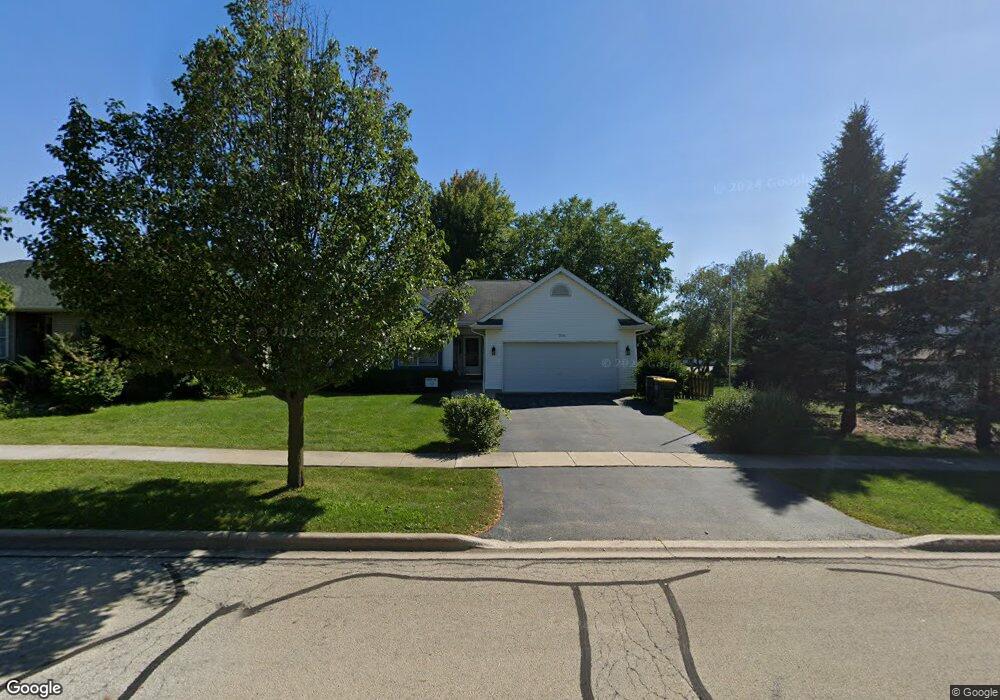
This home is located at 706 Aspen Way, Genoa, IL 60135 and is currently estimated at $291,479, approximately $217 per square foot. 706 Aspen Way is a home located in DeKalb County with nearby schools including Kingston Elementary School, Genoa Elementary School, and Genoa-Kingston Middle School.
Ownership History
Date
Name
Owned For
Owner Type
Purchase Details
Closed on
Jun 7, 2018
Sold by
Scioto Properties Sp 16 Llc
Bought by
Sbf 1 Properties Llc
Current Estimated Value
Home Financials for this Owner
Home Financials are based on the most recent Mortgage that was taken out on this home.
Original Mortgage
$50,283,000
Outstanding Balance
$16,147,198
Interest Rate
4.5%
Mortgage Type
Commercial
Estimated Equity
-$15,855,719
Purchase Details
Closed on
Oct 31, 2017
Sold by
Bright Brooke L
Bought by
Scioto Properties Sp 16 Llc
Purchase Details
Closed on
Oct 17, 2015
Sold by
Sichz Thomas H and Sichz Kristen E
Bought by
Bright Brooke L
Home Financials for this Owner
Home Financials are based on the most recent Mortgage that was taken out on this home.
Original Mortgage
$65,000
Interest Rate
4.13%
Mortgage Type
New Conventional
Create a Home Valuation Report for This Property
The Home Valuation Report is an in-depth analysis detailing your home's value as well as a comparison with similar homes in the area
Home Values in the Area
Average Home Value in this Area
Purchase History
| Date | Buyer | Sale Price | Title Company |
|---|---|---|---|
| Sbf 1 Properties Llc | -- | None Available | |
| Scioto Properties Sp 16 Llc | $182,000 | None Available | |
| Bright Brooke L | $115,000 | -- |
Source: Public Records
Mortgage History
| Date | Status | Borrower | Loan Amount |
|---|---|---|---|
| Open | Sbf 1 Properties Llc | $50,283,000 | |
| Previous Owner | Bright Brooke L | $65,000 |
Source: Public Records
Tax History Compared to Growth
Tax History
| Year | Tax Paid | Tax Assessment Tax Assessment Total Assessment is a certain percentage of the fair market value that is determined by local assessors to be the total taxable value of land and additions on the property. | Land | Improvement |
|---|---|---|---|---|
| 2024 | $6,763 | $76,681 | $15,131 | $61,550 |
| 2023 | $6,763 | $71,318 | $14,073 | $57,245 |
| 2022 | $6,815 | $68,973 | $13,610 | $55,363 |
| 2021 | $5,582 | $56,529 | $12,877 | $43,652 |
| 2020 | $5,614 | $55,936 | $12,742 | $43,194 |
| 2019 | $5,450 | $52,645 | $11,992 | $40,653 |
| 2018 | $5,299 | $50,258 | $11,448 | $38,810 |
| 2017 | $4,549 | $48,283 | $10,998 | $37,285 |
| 2016 | $4,066 | $43,361 | $10,972 | $32,389 |
| 2015 | -- | $42,320 | $10,709 | $31,611 |
| 2014 | -- | $41,596 | $10,526 | $31,070 |
| 2013 | -- | $41,533 | $10,510 | $31,023 |
Source: Public Records
Map
Nearby Homes
- 707 Cedar Ln
- 0000 Walnut St
- 519 S Sycamore St
- 728 Hawthorne Ln
- 111 S Sycamore St
- 0 Park Ave
- 120 Monroe St
- 408 Stearn Dr Unit 408
- 563 Stearn Dr Unit 563
- 437 Stearn Dr Unit 437
- 411 Stearn Dr Unit 411
- 508 Winding Trail
- 408 Winding Trail
- 1003 Joel Ln
- 1001 Joel Ln
- 128 N Brown St
- 138 N Brown St
- 427 Riverbend Dr
- 1212 Persimmon Dr
- 00 Sycamore Rd