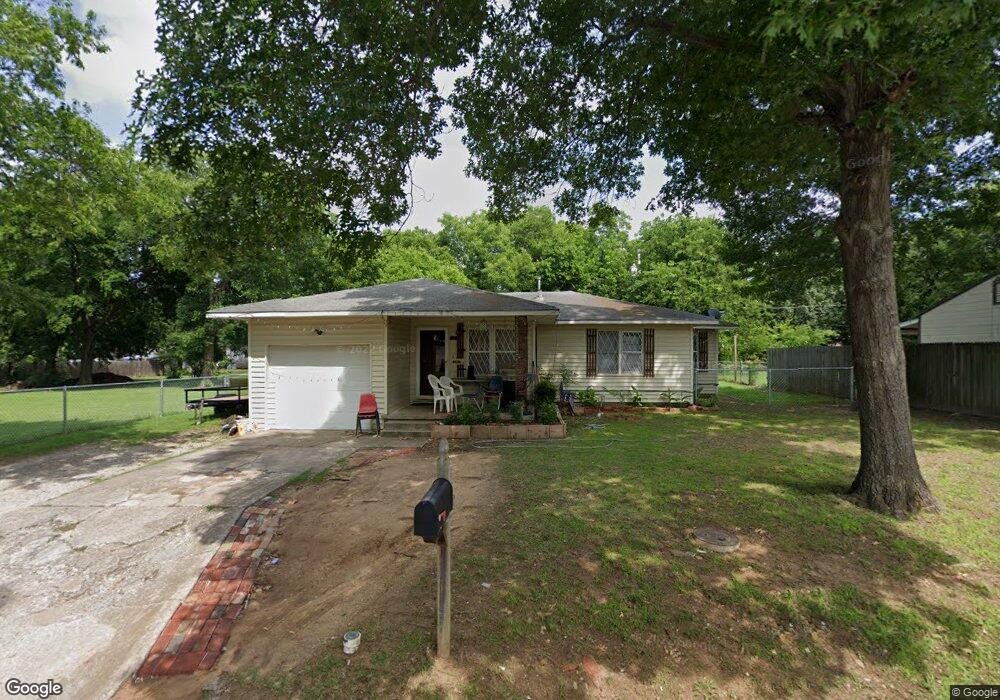
706 B St SE Ardmore, OK 73401
Estimated Value: $91,000 - $121,000
3
Beds
1
Bath
1,271
Sq Ft
$82/Sq Ft
Est. Value
About This Home
This home is located at 706 B St SE, Ardmore, OK 73401 and is currently estimated at $104,058, approximately $81 per square foot. 706 B St SE is a home located in Carter County with nearby schools including Jefferson Elementary School, Ardmore Middle School, and Ardmore High School.
Ownership History
Date
Name
Owned For
Owner Type
Purchase Details
Closed on
Aug 8, 2003
Sold by
Federal Nat. Mortgage Ass
Bought by
Davenport Jackie L and Davenport Gl
Current Estimated Value
Purchase Details
Closed on
Mar 5, 2003
Sold by
Rose Maxine G
Bought by
Federal Nat. Mortgage Ass
Purchase Details
Closed on
Sep 1, 1999
Sold by
Rose Clarence G
Bought by
Rose Maxine G
Purchase Details
Closed on
Feb 5, 1999
Sold by
Rose Maxine
Bought by
Rose Clarence G
Purchase Details
Closed on
Aug 17, 1992
Sold by
Rose Clarence G
Bought by
Rose, Maxine Life Est
Create a Home Valuation Report for This Property
The Home Valuation Report is an in-depth analysis detailing your home's value as well as a comparison with similar homes in the area
Home Values in the Area
Average Home Value in this Area
Purchase History
| Date | Buyer | Sale Price | Title Company |
|---|---|---|---|
| Davenport Jackie L | -- | -- | |
| Federal Nat. Mortgage Ass | -- | -- | |
| Rose Maxine G | -- | -- | |
| Rose Clarence G | -- | -- | |
| Rose, Maxine Life Est | -- | -- |
Source: Public Records
Tax History Compared to Growth
Tax History
| Year | Tax Paid | Tax Assessment Tax Assessment Total Assessment is a certain percentage of the fair market value that is determined by local assessors to be the total taxable value of land and additions on the property. | Land | Improvement |
|---|---|---|---|---|
| 2024 | $523 | $6,302 | $663 | $5,639 |
| 2023 | $505 | $6,119 | $647 | $5,472 |
| 2022 | $472 | $5,941 | $625 | $5,316 |
| 2021 | $481 | $5,768 | $592 | $5,176 |
| 2020 | $457 | $5,600 | $540 | $5,060 |
| 2019 | $447 | $5,600 | $540 | $5,060 |
| 2018 | $454 | $5,600 | $540 | $5,060 |
| 2017 | $443 | $5,847 | $540 | $5,307 |
| 2016 | $535 | $5,735 | $540 | $5,195 |
| 2015 | $461 | $6,000 | $540 | $5,460 |
| 2014 | $337 | $4,391 | $195 | $4,196 |
Source: Public Records
Map
Nearby Homes