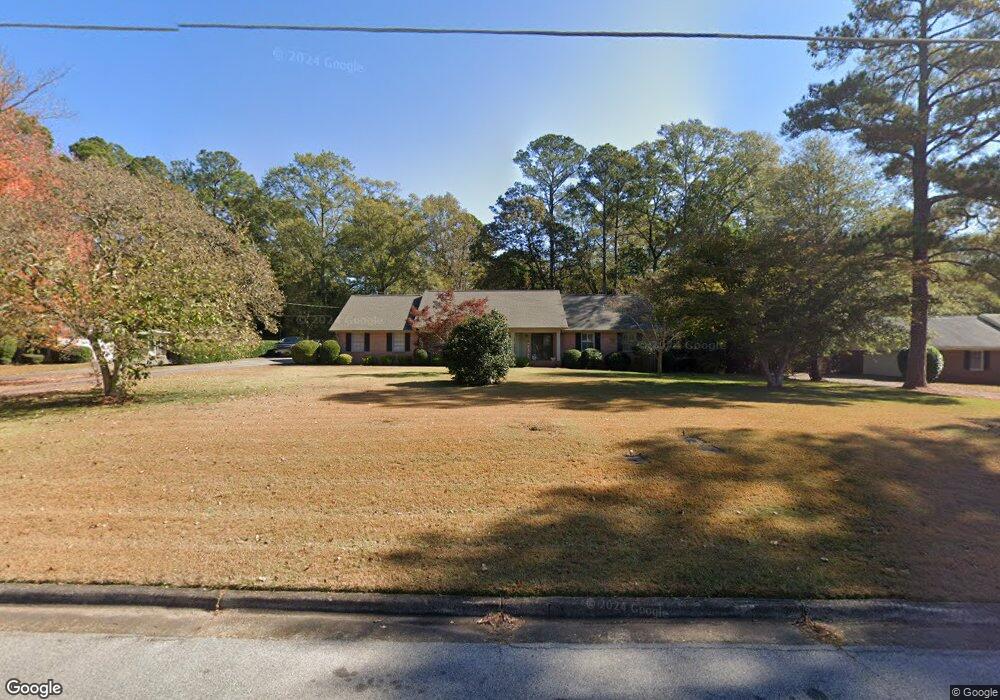
706 Camellia Dr Lagrange, GA 30240
Estimated Value: $333,429 - $399,000
4
Beds
3
Baths
2,330
Sq Ft
$162/Sq Ft
Est. Value
About This Home
This home is located at 706 Camellia Dr, Lagrange, GA 30240 and is currently estimated at $376,857, approximately $161 per square foot. 706 Camellia Dr is a home located in Troup County with nearby schools including Hollis Hand Elementary School, Franklin Forest Elementary School, and Ethel W. Kight Elementary School.
Ownership History
Date
Name
Owned For
Owner Type
Purchase Details
Closed on
Aug 18, 2000
Sold by
Thomas Sheffield
Bought by
Davis Billy W
Current Estimated Value
Purchase Details
Closed on
May 29, 1992
Sold by
Jean S Ayers
Bought by
Thomas Sheffield
Purchase Details
Closed on
Jan 6, 1990
Sold by
City Of Lag
Bought by
Jean S Ayers
Purchase Details
Closed on
Apr 1, 1984
Sold by
Jean Grady and Jean Elliott
Bought by
City Of Lag
Purchase Details
Closed on
Jan 29, 1979
Sold by
Barbara Jean Smith
Bought by
Jean Grady and Jean Elliott
Purchase Details
Closed on
Jun 3, 1977
Sold by
Harriett Thomas and Harriett Wells
Bought by
Barbara Jean Smith
Purchase Details
Closed on
Jan 1, 1974
Sold by
Whatley
Bought by
Harriett Thomas and Harriett Wells
Purchase Details
Closed on
Jan 1, 1973
Sold by
Piney Woods Co
Bought by
Whatley
Create a Home Valuation Report for This Property
The Home Valuation Report is an in-depth analysis detailing your home's value as well as a comparison with similar homes in the area
Home Values in the Area
Average Home Value in this Area
Purchase History
| Date | Buyer | Sale Price | Title Company |
|---|---|---|---|
| Davis Billy W | $192,500 | -- | |
| Thomas Sheffield | $125,000 | -- | |
| Jean S Ayers | -- | -- | |
| City Of Lag | -- | -- | |
| Jean Grady | -- | -- | |
| Barbara Jean Smith | -- | -- | |
| Harriett Thomas | -- | -- | |
| Whatley | -- | -- |
Source: Public Records
Tax History Compared to Growth
Tax History
| Year | Tax Paid | Tax Assessment Tax Assessment Total Assessment is a certain percentage of the fair market value that is determined by local assessors to be the total taxable value of land and additions on the property. | Land | Improvement |
|---|---|---|---|---|
| 2024 | $2,725 | $101,920 | $16,000 | $85,920 |
| 2023 | $2,564 | $96,000 | $16,000 | $80,000 |
| 2022 | $2,514 | $92,080 | $16,000 | $76,080 |
| 2021 | $1,987 | $67,880 | $16,000 | $51,880 |
| 2020 | $1,987 | $67,880 | $16,000 | $51,880 |
| 2019 | $1,992 | $68,040 | $16,000 | $52,040 |
| 2018 | $1,917 | $65,560 | $16,000 | $49,560 |
| 2017 | $1,830 | $62,680 | $16,000 | $46,680 |
| 2016 | $1,823 | $62,413 | $16,000 | $46,413 |
| 2015 | $1,826 | $62,413 | $16,000 | $46,413 |
| 2014 | $1,737 | $59,379 | $16,000 | $43,379 |
| 2013 | -- | $64,806 | $16,000 | $48,806 |
Source: Public Records
Map
Nearby Homes
- 145 Turner St
- 102 Ewing St
- 748 Lakewood Dr
- 724 Camellia Dr
- 106 Ewing St
- 109 Thomas St
- 900 North St
- 110 Russell St
- 201 S Chilton Crescent
- 219 Banks St
- 106 S Chilton Crescent
- 204 Colonial St
- 203 S Chilton Crescent
- 705 Piney Woods Dr
- 806 New Franklin Rd
- 105 Saynor Cir
- 408 Gordon St
- 609 Cherokee Rd
- 114 Briarcliff Rd
- 100 Creekside Dr Unit LOT 60A
- 704 Camellia Dr
- 708 Camellia Dr
- 703 Camellia Dr
- 153 Turner St
- 149 Turner St
- 149 Turner St
- 151 Turner St
- 710 Camellia Dr
- 705 Camellia Dr
- 707 Camellia Dr
- 730 Azalea Dr
- 718 Azalea Dr
- 712 Camellia Dr
- 147 Turner St
- 732 Azalea Dr
- 714 Azalea Dr
- 709 Camellia Dr
- 143 Turner St
- 736 Azalea Dr
- 714 Camellia Dr Unit 202