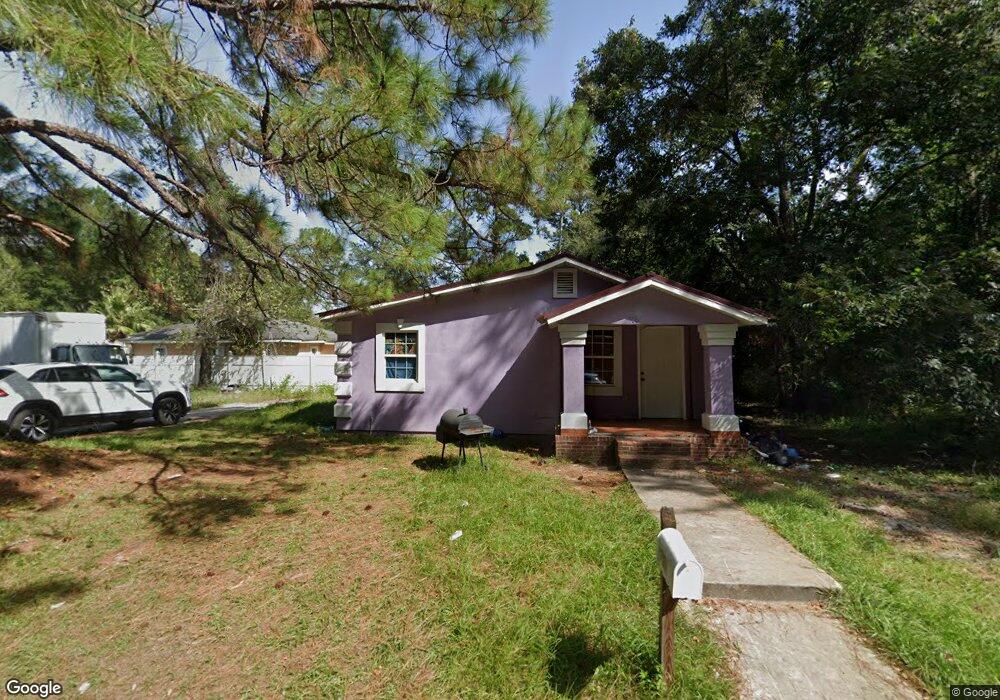
706 Columbus St Waycross, GA 31503
Estimated Value: $75,000 - $95,315
1
Bed
1
Bath
896
Sq Ft
$93/Sq Ft
Est. Value
About This Home
This home is located at 706 Columbus St, Waycross, GA 31503 and is currently estimated at $83,579, approximately $93 per square foot. 706 Columbus St is a home located in Ware County with nearby schools including Waresboro Elementary School, Ware County Middle School, and Ware County High School.
Ownership History
Date
Name
Owned For
Owner Type
Purchase Details
Closed on
Apr 4, 2018
Sold by
Delgadillo Juan G
Bought by
Marquez Rodolfo
Current Estimated Value
Purchase Details
Closed on
Oct 22, 2013
Sold by
Home America Llc
Bought by
Delgadillo Juan G and Rios Lucila
Purchase Details
Closed on
Dec 30, 2011
Sold by
Wells Fargo Bank Na
Bought by
Home America Llc
Purchase Details
Closed on
Aug 2, 2011
Sold by
Danford Christopher
Bought by
Wells Fargo Bank Na
Purchase Details
Closed on
Jan 3, 2011
Sold by
Wells Fargo Bankk Na Trust
Bought by
Home America Llc
Purchase Details
Closed on
Oct 14, 2005
Sold by
Danford Richard
Bought by
Danford Christopher
Purchase Details
Closed on
Dec 9, 2003
Sold by
Ross Henry
Bought by
Danford Richard
Purchase Details
Closed on
Jan 16, 2002
Sold by
Raulerson Jlj
Bought by
Ross Henry
Purchase Details
Closed on
Nov 20, 1987
Create a Home Valuation Report for This Property
The Home Valuation Report is an in-depth analysis detailing your home's value as well as a comparison with similar homes in the area
Home Values in the Area
Average Home Value in this Area
Purchase History
| Date | Buyer | Sale Price | Title Company |
|---|---|---|---|
| Marquez Rodolfo | -- | -- | |
| Delgadillo Juan G | $10,000 | -- | |
| Home America Llc | $4,000 | -- | |
| Wells Fargo Bank Na | $11,000 | -- | |
| Home America Llc | $40,000 | -- | |
| Danford Christopher | -- | -- | |
| Danford Richard | $5,000 | -- | |
| Danford Richard | $5,000 | -- | |
| Ross Henry | $11,000 | -- | |
| -- | $6,700 | -- |
Source: Public Records
Tax History Compared to Growth
Tax History
| Year | Tax Paid | Tax Assessment Tax Assessment Total Assessment is a certain percentage of the fair market value that is determined by local assessors to be the total taxable value of land and additions on the property. | Land | Improvement |
|---|---|---|---|---|
| 2024 | $615 | $16,014 | $962 | $15,052 |
| 2023 | $552 | $15,758 | $680 | $15,078 |
| 2022 | $628 | $15,758 | $680 | $15,078 |
| 2021 | $510 | $11,800 | $680 | $11,120 |
| 2020 | $507 | $11,631 | $680 | $10,951 |
| 2019 | $402 | $9,104 | $680 | $8,424 |
| 2018 | $388 | $8,683 | $680 | $8,003 |
| 2017 | $379 | $8,683 | $680 | $8,003 |
| 2016 | $379 | $8,683 | $680 | $8,003 |
| 2015 | $381 | $8,682 | $680 | $8,003 |
| 2014 | $175 | $8,682 | $680 | $8,003 |
| 2013 | -- | $8,606 | $679 | $7,926 |
Source: Public Records
Map
Nearby Homes
- 6905 Kendal Ct
- 0 Camp Branch Cross Rd Unit 12958956
- 0 Camp Branch Cross Rd Unit 147575
- 0 Camp Branch Cross Rd Unit 10127958
- 1401 Carswell Ave
- 00 Roosevelt St
- 1322 Jane St
- 0 S Georgia Pkwy W
- 605 Walker St
- 1208 Margaret St
- 1006 Roosevelt St
- 1003 Carswell Ave
- 601 N Nicholls St
- 505 N Nicholls St
- 503 N Nicholls St
- 1125 Georgia St
- 1103 Ann St
- 1027 Robert St
- 506 McDonald St
- 516 Folks St
- 1533 Roosevelt St
- 800 Columbus St
- 1530 Roosevelt St
- 1526 Myers Ave
- 1528 Roosevelt St
- 1527 Roosevelt St
- 606 Columbus St
- 1525 Ketterer St
- 1527 Ketterer St
- 1524 Carswell Ave
- 1522 Myers Ave
- 0000 Ketterer St
- 0 Ketterer St
- 1527 N Ketterer
- 1528 Carswell Ave
- 1515 Roosevelt St
- 1520 Roosevelt St
- 1516 Myers Ave
- 1522 Carswell Ave
- 1612 Carswell Ave Unit A2