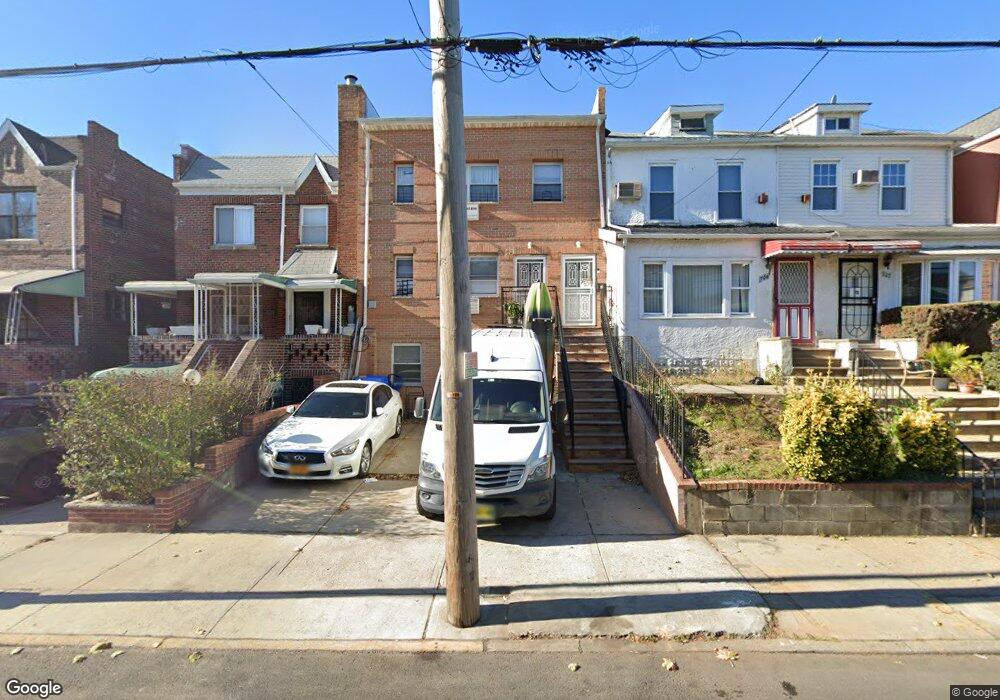
706 E 52nd St Unit BLDG Brooklyn, NY 11203
East Flatbush NeighborhoodEstimated Value: $920,000 - $1,052,605
6
Beds
3
Baths
2,511
Sq Ft
$403/Sq Ft
Est. Value
About This Home
This home is located at 706 E 52nd St Unit BLDG, Brooklyn, NY 11203 and is currently estimated at $1,012,651, approximately $403 per square foot. 706 E 52nd St Unit BLDG is a home located in Kings County with nearby schools including P.S. 208 Elsa Ebeling, I.S. 285 Meyer Levin, and Ivy Hill Preparatory Charter School.
Ownership History
Date
Name
Owned For
Owner Type
Purchase Details
Closed on
Sep 18, 2017
Sold by
Kings 52Nd Development Llc
Bought by
Charles-Duke Andrea
Current Estimated Value
Home Financials for this Owner
Home Financials are based on the most recent Mortgage that was taken out on this home.
Original Mortgage
$544,000
Outstanding Balance
$454,157
Interest Rate
3.89%
Mortgage Type
Purchase Money Mortgage
Estimated Equity
$558,494
Purchase Details
Closed on
Jun 14, 2010
Sold by
Kings 52Nd Corp
Bought by
Kings 52Nd Development Llc
Create a Home Valuation Report for This Property
The Home Valuation Report is an in-depth analysis detailing your home's value as well as a comparison with similar homes in the area
Home Values in the Area
Average Home Value in this Area
Purchase History
| Date | Buyer | Sale Price | Title Company |
|---|---|---|---|
| Charles-Duke Andrea | $680,000 | -- | |
| Kings 52Nd Development Llc | -- | -- |
Source: Public Records
Mortgage History
| Date | Status | Borrower | Loan Amount |
|---|---|---|---|
| Open | Charles-Duke Andrea | $544,000 |
Source: Public Records
Tax History
| Year | Tax Paid | Tax Assessment Tax Assessment Total Assessment is a certain percentage of the fair market value that is determined by local assessors to be the total taxable value of land and additions on the property. | Land | Improvement |
|---|---|---|---|---|
| 2025 | $7,167 | $65,400 | $8,640 | $56,760 |
| 2024 | $7,167 | $68,400 | $8,640 | $59,760 |
| 2023 | $7,247 | $63,420 | $8,640 | $54,780 |
| 2022 | $7,070 | $56,100 | $8,640 | $47,460 |
| 2021 | $7,031 | $43,440 | $8,640 | $34,800 |
| 2020 | $3,297 | $40,140 | $8,640 | $31,500 |
| 2019 | $6,221 | $40,140 | $8,640 | $31,500 |
| 2018 | $6,062 | $29,736 | $6,997 | $22,739 |
| 2017 | $6,016 | $29,511 | $6,186 | $23,325 |
| 2016 | $5,566 | $27,841 | $6,997 | $20,844 |
| 2015 | $3,687 | $26,266 | $6,355 | $19,911 |
| 2014 | $3,687 | $24,780 | $7,200 | $17,580 |
Source: Public Records
Map
Nearby Homes
Your Personal Tour Guide
Ask me questions while you tour the home.