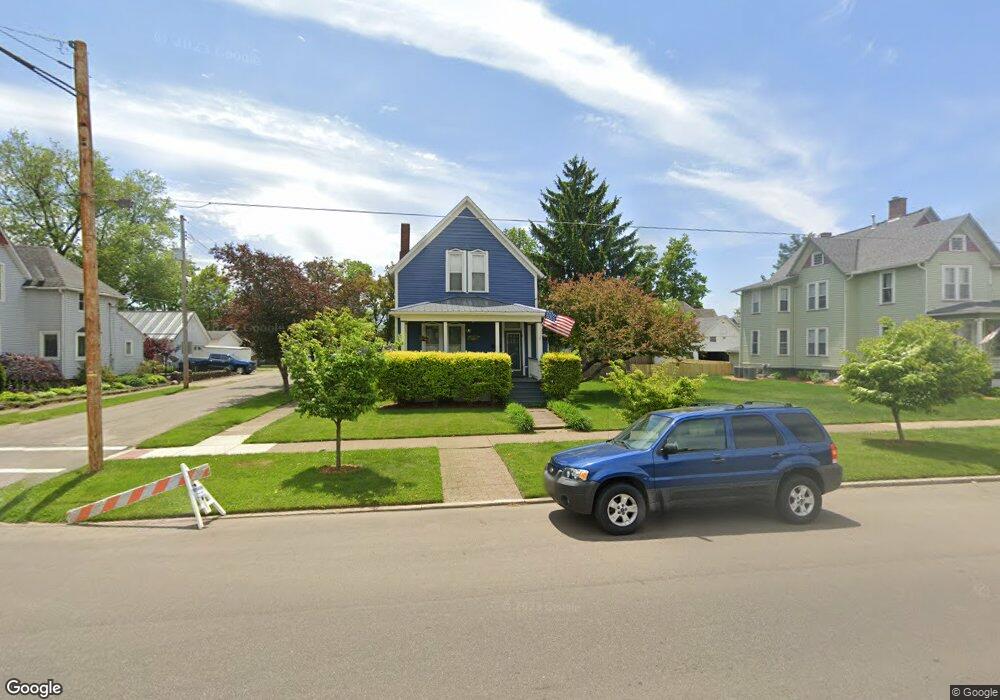
706 E High St Mount Vernon, OH 43050
Estimated Value: $209,000 - $272,000
3
Beds
2
Baths
1,232
Sq Ft
$188/Sq Ft
Est. Value
About This Home
This home is located at 706 E High St, Mount Vernon, OH 43050 and is currently estimated at $231,544, approximately $187 per square foot. 706 E High St is a home with nearby schools including Mount Vernon High School, St. Vincent de Paul School, and Christian Star Academy.
Ownership History
Date
Name
Owned For
Owner Type
Purchase Details
Closed on
Dec 21, 2011
Sold by
M L K T Properties Llc
Bought by
Marofsky Christopher P
Current Estimated Value
Home Financials for this Owner
Home Financials are based on the most recent Mortgage that was taken out on this home.
Original Mortgage
$102,338
Outstanding Balance
$71,631
Interest Rate
4.5%
Mortgage Type
FHA
Estimated Equity
$159,913
Purchase Details
Closed on
Mar 21, 2005
Sold by
Woosley Thomas V and Woosley Kellye
Bought by
M L K T Properties Llc
Purchase Details
Closed on
May 13, 2004
Sold by
Woosley Thomas V and Woosley Kel
Bought by
Wiest Mark E and Wiest Laura L
Purchase Details
Closed on
Feb 13, 2004
Bought by
Woosley Thomas and Woosley Kel
Purchase Details
Closed on
Nov 18, 2003
Sold by
Kinney John E and Kinney Michele L
Bought by
Fannie Mae-Aka Fed Natl M
Purchase Details
Closed on
Feb 26, 1998
Sold by
Myers John B
Bought by
Kinney John E and Kinney Michele L
Purchase Details
Closed on
Apr 3, 1991
Sold by
Jones Judy L
Bought by
Myers John B
Purchase Details
Closed on
Jul 1, 1987
Sold by
Grove Grove J J and Grove Clau
Bought by
Jones Judy L
Create a Home Valuation Report for This Property
The Home Valuation Report is an in-depth analysis detailing your home's value as well as a comparison with similar homes in the area
Home Values in the Area
Average Home Value in this Area
Purchase History
| Date | Buyer | Sale Price | Title Company |
|---|---|---|---|
| Marofsky Christopher P | $78,750 | None Available | |
| M L K T Properties Llc | -- | None Available | |
| Wiest Mark E | -- | -- | |
| Woosley Thomas | $59,000 | -- | |
| Fannie Mae-Aka Fed Natl M | $60,000 | -- | |
| Kinney John E | $72,500 | -- | |
| Myers John B | $51,500 | -- | |
| Jones Judy L | $46,000 | -- |
Source: Public Records
Mortgage History
| Date | Status | Borrower | Loan Amount |
|---|---|---|---|
| Open | Marofsky Christopher P | $102,338 |
Source: Public Records
Tax History
| Year | Tax Paid | Tax Assessment Tax Assessment Total Assessment is a certain percentage of the fair market value that is determined by local assessors to be the total taxable value of land and additions on the property. | Land | Improvement |
|---|---|---|---|---|
| 2024 | $1,901 | $50,350 | $16,460 | $33,890 |
| 2023 | $1,943 | $50,350 | $16,460 | $33,890 |
| 2022 | $1,709 | $40,280 | $13,170 | $27,110 |
| 2021 | $1,709 | $40,280 | $13,170 | $27,110 |
| 2020 | $1,665 | $40,280 | $13,170 | $27,110 |
| 2019 | $1,728 | $38,980 | $14,220 | $24,760 |
| 2018 | $1,728 | $38,980 | $14,220 | $24,760 |
| 2017 | $1,697 | $38,980 | $14,220 | $24,760 |
| 2016 | $1,575 | $36,100 | $13,170 | $22,930 |
| 2015 | $1,582 | $36,100 | $13,170 | $22,930 |
| 2014 | $1,590 | $36,100 | $13,170 | $22,930 |
| 2013 | $1,237 | $26,660 | $12,380 | $14,280 |
Source: Public Records
Map
Nearby Homes
- 213 Coshocton Ave
- 111 Potwin St
- 501 Oak St
- 203 S Center St
- 649 Howard St
- 655 Howard St
- 418 E Pleasant St
- 900 E Gambier St
- 812 Howard St
- 11 Highland Dr
- 1107 Oak Street Extension
- 208 E Burgess St
- 12 3rd Ave
- 12 Third Ave
- 6 Edgewood Blvd
- 0 Miami St
- 14 Hilltop Dr
- 304 N Gay St
- 802 Coshocton Ave
- 22 E Gamber St