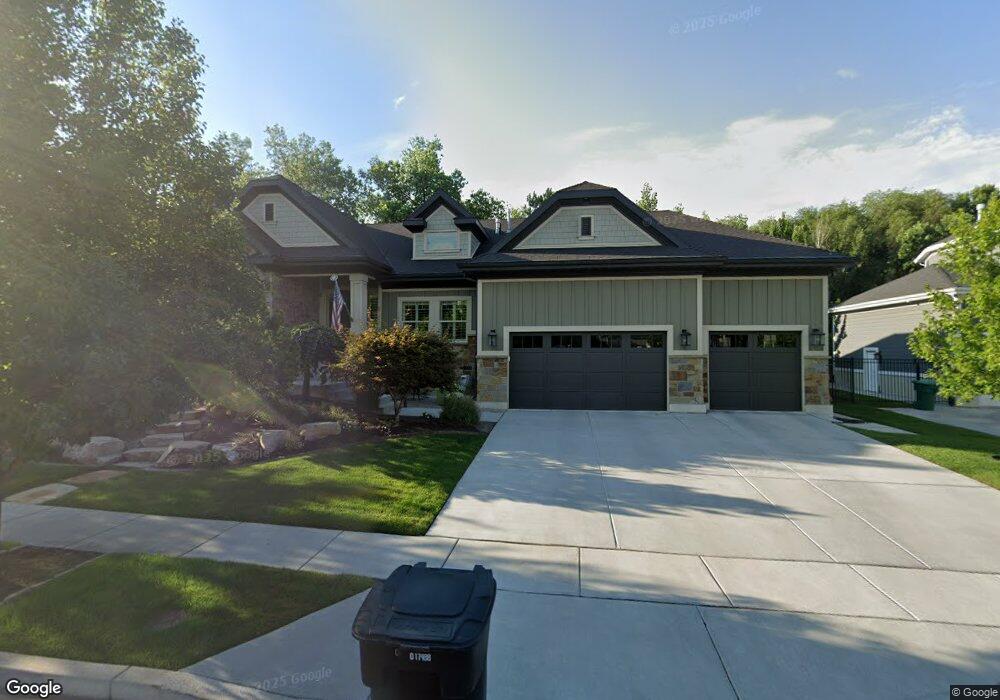
706 E Oxford Hollow Ct Murray, UT 84107
Estimated Value: $1,217,000 - $1,635,000
1
Bed
2
Baths
5,445
Sq Ft
$254/Sq Ft
Est. Value
About This Home
This home is located at 706 E Oxford Hollow Ct, Murray, UT 84107 and is currently estimated at $1,383,591, approximately $254 per square foot. 706 E Oxford Hollow Ct is a home located in Salt Lake County with nearby schools including McMillan Elementary School, Hillcrest Junior High School, and Murray High School.
Ownership History
Date
Name
Owned For
Owner Type
Purchase Details
Closed on
Dec 17, 2021
Sold by
Lynette E Layman Revocable Trust
Bought by
Layman Lynette E
Current Estimated Value
Home Financials for this Owner
Home Financials are based on the most recent Mortgage that was taken out on this home.
Original Mortgage
$5,000,000
Outstanding Balance
$4,597,455
Interest Rate
3.09%
Mortgage Type
New Conventional
Estimated Equity
-$3,213,864
Purchase Details
Closed on
Sep 13, 2017
Sold by
Layman John A and Layman Lynette E
Bought by
Layman Lynette E and The Lynette E Layman Revocable Trust
Purchase Details
Closed on
Jan 13, 2015
Sold by
Ivory Homes Ltd
Bought by
Layman John A and Layman Lynette E
Home Financials for this Owner
Home Financials are based on the most recent Mortgage that was taken out on this home.
Original Mortgage
$770,057
Interest Rate
3.37%
Mortgage Type
Adjustable Rate Mortgage/ARM
Create a Home Valuation Report for This Property
The Home Valuation Report is an in-depth analysis detailing your home's value as well as a comparison with similar homes in the area
Home Values in the Area
Average Home Value in this Area
Purchase History
| Date | Buyer | Sale Price | Title Company |
|---|---|---|---|
| Layman Lynette E | $6,650,000 | Pioneer Title | |
| Layman Lynette E | -- | None Available | |
| Layman John A | -- | Cottonwood Title | |
| Ivory Homes Ltd | -- | Cottonwood Title |
Source: Public Records
Mortgage History
| Date | Status | Borrower | Loan Amount |
|---|---|---|---|
| Open | Layman Lynette E | $5,000,000 | |
| Previous Owner | Layman John A | $770,057 |
Source: Public Records
Tax History Compared to Growth
Tax History
| Year | Tax Paid | Tax Assessment Tax Assessment Total Assessment is a certain percentage of the fair market value that is determined by local assessors to be the total taxable value of land and additions on the property. | Land | Improvement |
|---|---|---|---|---|
| 2025 | -- | $1,217,600 | $407,000 | $810,600 |
| 2024 | -- | $1,179,300 | $393,600 | $785,700 |
| 2023 | -- | $1,055,100 | $341,600 | $713,500 |
| 2022 | $0 | $1,023,700 | $334,900 | $688,800 |
| 2021 | $5,210 | $914,800 | $370,800 | $544,000 |
| 2020 | $5,074 | $842,700 | $370,800 | $471,900 |
| 2019 | $5,302 | $850,400 | $358,800 | $491,600 |
| 2018 | $0 | $825,400 | $358,800 | $466,600 |
| 2017 | $4,933 | $812,200 | $266,600 | $545,600 |
| 2016 | $5,081 | $807,600 | $266,600 | $541,000 |
| 2015 | $3,951 | $570,400 | $229,800 | $340,600 |
Source: Public Records
Map
Nearby Homes
- 5809 Holstein Way
- 664 E 5720 S
- 537 E Edindrew Dr
- 869 E Vine St
- 602 E 5600 S
- 418 E Bridlewalk Ln
- 832 E Deerfield Rd
- 5536 Springtree Ln Unit A
- 5560 S Willow Ln Unit D
- 5561 S Willow Ln Unit F
- 5555 S Willow Ln Unit E
- 5572 S Avalon Dr
- 5882 Meadowcrest Dr
- 5775 S Fashion Blvd
- 361 Mcmillan Ln
- 5519 S Willow Ln Unit C
- 5762 S Mcmillan Cir
- 5769 S Hillside Dr
- 5508 S Willow Ln
- 404 E 5600 S
- 694 E Oxford Hollow Ct
- 718 E Oxford Hollow Ct
- 5813 Royalton Dr
- 678 E Oxford Hollow Ct
- 5786 S Erekson Ln
- 699 E Oxford Hollow Ct
- 5815 S Royalton Dr
- 732 E Erekson Ct
- 5815 S Royalton Dr
- 681 E Oxford Hollow Ct
- 5820 Royalton Dr
- 5820 S Royalton Dr
- 5712 S Erekson Ct
- 703 E Oxford Hollow Ct
- 662 E Oxford Hollow Ct
- 5823 Royalton Dr
- 734 E Erekson Ct
- 738 E Erekson Ct
- 5768 S 730 E
- 708 E Walnut Brook Dr