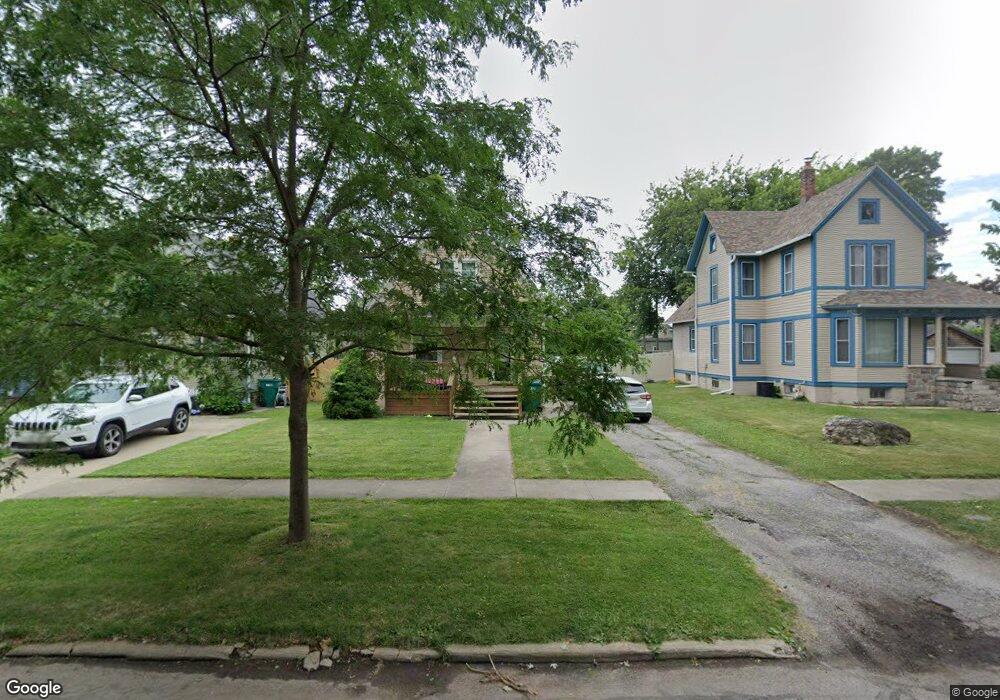
706 E St La Porte, IN 46350
Estimated Value: $152,004 - $168,000
2
Beds
1
Bath
1,312
Sq Ft
$123/Sq Ft
Est. Value
About This Home
This home is located at 706 E St, La Porte, IN 46350 and is currently estimated at $161,501, approximately $123 per square foot. 706 E St is a home located in LaPorte County with nearby schools including Handley Elementary School, La Porte High School, and Kesling Intermediate School.
Ownership History
Date
Name
Owned For
Owner Type
Purchase Details
Closed on
Dec 3, 2024
Sold by
Kerchner Sherry
Bought by
Bisom Lucille M and Bisom Earl
Current Estimated Value
Purchase Details
Closed on
Nov 22, 2024
Sold by
Colburn Linda and Bisom Lucille M
Bought by
Bisom Lucille M and Bisom Earl
Purchase Details
Closed on
Feb 25, 2015
Sold by
Krol Lucille M
Bought by
Krol Lucille M and Colburn Linda
Purchase Details
Closed on
Jan 23, 2008
Sold by
Krol Lucille M
Bought by
Krol Lucille M and Lucille M Krol Trust
Create a Home Valuation Report for This Property
The Home Valuation Report is an in-depth analysis detailing your home's value as well as a comparison with similar homes in the area
Home Values in the Area
Average Home Value in this Area
Purchase History
| Date | Buyer | Sale Price | Title Company |
|---|---|---|---|
| Bisom Lucille M | -- | None Listed On Document | |
| Bisom Lucille M | -- | None Listed On Document | |
| Bisom Lucille M | -- | None Listed On Document | |
| Krol Lucille M | -- | None Available | |
| Krol Lucille M | -- | None Available |
Source: Public Records
Tax History
| Year | Tax Paid | Tax Assessment Tax Assessment Total Assessment is a certain percentage of the fair market value that is determined by local assessors to be the total taxable value of land and additions on the property. | Land | Improvement |
|---|---|---|---|---|
| 2025 | $2,289 | $114,900 | $11,500 | $103,400 |
| 2024 | $1,087 | $110,500 | $11,500 | $99,000 |
| 2023 | $1,008 | $100,800 | $9,600 | $91,200 |
| 2022 | $903 | $90,300 | $9,600 | $80,700 |
| 2021 | $840 | $84,000 | $9,600 | $74,400 |
| 2020 | $769 | $84,000 | $9,600 | $74,400 |
| 2019 | $833 | $79,100 | $11,500 | $67,600 |
| 2018 | $729 | $72,300 | $10,100 | $62,200 |
| 2017 | $665 | $68,600 | $10,100 | $58,500 |
| 2016 | $1,492 | $71,900 | $10,100 | $61,800 |
| 2014 | $603 | $65,600 | $10,100 | $55,500 |
Source: Public Records
Map
Nearby Homes
Your Personal Tour Guide
Ask me questions while you tour the home.