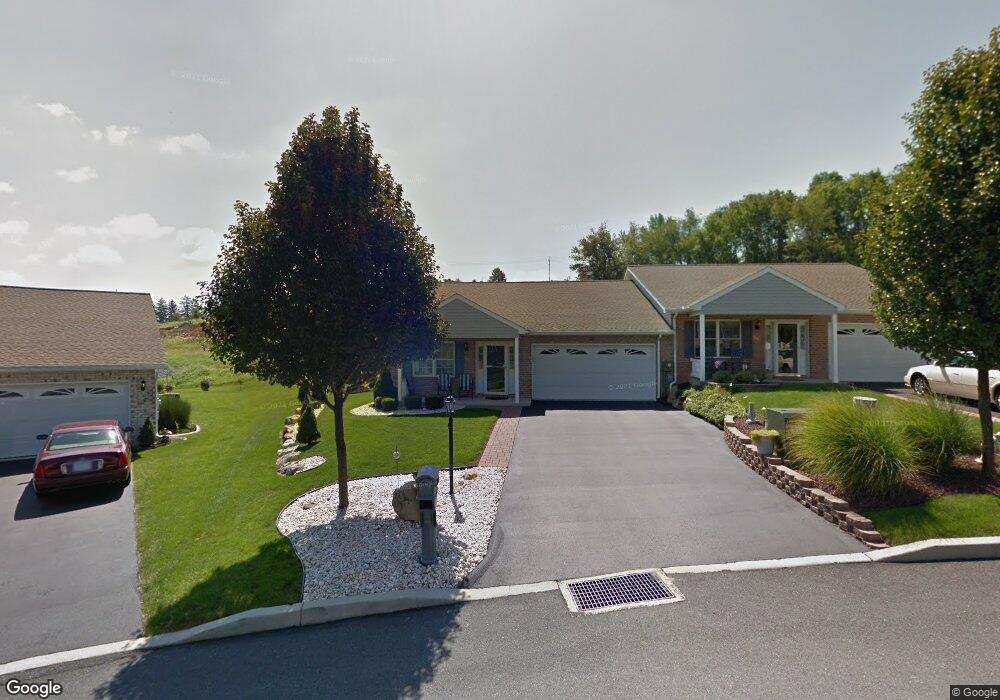
706 Fir Spring Dr Waynesboro, PA 17268
Estimated Value: $247,033 - $317,000
--
Bed
--
Bath
1,880
Sq Ft
$157/Sq Ft
Est. Value
About This Home
This home is located at 706 Fir Spring Dr, Waynesboro, PA 17268 and is currently estimated at $294,758, approximately $156 per square foot. 706 Fir Spring Dr is a home located in Franklin County with nearby schools including Waynesboro Area Senior High School, St. Andrew Catholic School, and Noah's Ark Christian Child Care Center.
Ownership History
Date
Name
Owned For
Owner Type
Purchase Details
Closed on
Mar 3, 2023
Sold by
Oneill Brian L and Oneill Jennifer L
Bought by
Salty Willows Llc
Current Estimated Value
Purchase Details
Closed on
Aug 10, 2017
Sold by
Mcconnell Violet S
Bought by
Neill Brian L O and Neill Jennifer L O
Home Financials for this Owner
Home Financials are based on the most recent Mortgage that was taken out on this home.
Original Mortgage
$175,000
Interest Rate
3.88%
Mortgage Type
Purchase Money Mortgage
Purchase Details
Closed on
Apr 30, 2013
Sold by
Smith David S and Smith Carolyn J
Bought by
Mcconnell Franklin J and Mcconnell Violet S
Purchase Details
Closed on
Feb 23, 2005
Sold by
Zaiger Builders Inc
Bought by
Smith David S and Smith Carolyn J
Create a Home Valuation Report for This Property
The Home Valuation Report is an in-depth analysis detailing your home's value as well as a comparison with similar homes in the area
Home Values in the Area
Average Home Value in this Area
Purchase History
| Date | Buyer | Sale Price | Title Company |
|---|---|---|---|
| Salty Willows Llc | -- | None Listed On Document | |
| Neill Brian L O | -- | None Available | |
| Mcconnell Franklin J | $199,500 | None Available | |
| Smith David S | $171,900 | None Available |
Source: Public Records
Mortgage History
| Date | Status | Borrower | Loan Amount |
|---|---|---|---|
| Previous Owner | Neill Brian L O | $175,000 |
Source: Public Records
Tax History Compared to Growth
Tax History
| Year | Tax Paid | Tax Assessment Tax Assessment Total Assessment is a certain percentage of the fair market value that is determined by local assessors to be the total taxable value of land and additions on the property. | Land | Improvement |
|---|---|---|---|---|
| 2025 | $4,767 | $26,300 | $1,280 | $25,020 |
| 2024 | $4,648 | $26,300 | $1,280 | $25,020 |
| 2023 | $4,442 | $25,700 | $1,280 | $24,420 |
| 2022 | $4,301 | $25,700 | $1,280 | $24,420 |
| 2021 | $4,082 | $25,700 | $1,280 | $24,420 |
| 2020 | $4,050 | $25,700 | $1,280 | $24,420 |
| 2019 | $3,973 | $25,700 | $1,280 | $24,420 |
| 2018 | $3,748 | $25,700 | $1,280 | $24,420 |
| 2017 | $3,678 | $25,700 | $1,280 | $24,420 |
| 2016 | $736 | $25,700 | $1,280 | $24,420 |
| 2015 | $686 | $25,700 | $1,280 | $24,420 |
| 2014 | $686 | $25,700 | $1,280 | $24,420 |
Source: Public Records
Map
Nearby Homes
- 158 Bradford Spring Ct
- 504 Cleveland Ave
- 422 Cleveland Ave
- 217 Fairview Ave
- 435 Scott Ave
- 101 Fairview Ave
- 0 Westview Ave
- 462 Scott Ave Unit 4
- 25 Fairview Ave
- 208 Hamilton Ave
- 6668 Marsh Rd
- 418 W 6th St
- 12708 Cold Springs Rd
- 144 W Main St
- 115 W 2nd St
- 145 W Main St
- 336 Fairmount Ave
- 300 N Franklin St
- 109 Garfield St
- 303 Grandview Ave
- 708 Fir Spring Dr
- 704 Fir Spring Dr
- 710 Fir Spring Dr
- 710 Fir Spring Dr Unit 142
- 712 Fir Spring Dr
- 707 Fir Spring Dr
- 709 Fir Spring Dr
- 700 Golden Spring Dr
- 619 Chicory Spring Ct
- 617 Chicory Spring Ct
- 711 Fir Spring Dr
- 702 Golden Spring Dr
- 615 Chicory Spring Ct
- 746 Golden Spring Dr
- 613 Chicory Spring Ct
- 748 Golden Spring Dr
- 704 Golden Spring Dr
- 703 Fir Spring Dr
- 744 Golden Spring Dr
- 750 Golden Spring Dr