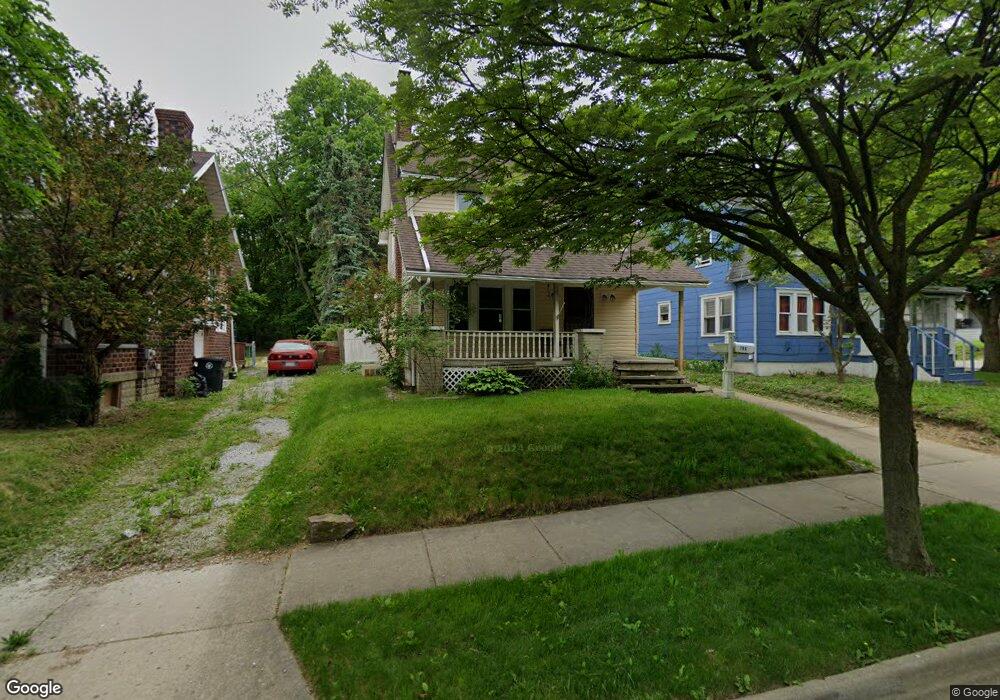
706 Lakemont Ave Akron, OH 44314
Kenmore NeighborhoodEstimated Value: $74,000 - $108,000
3
Beds
1
Bath
1,336
Sq Ft
$72/Sq Ft
Est. Value
About This Home
This home is located at 706 Lakemont Ave, Akron, OH 44314 and is currently estimated at $95,880, approximately $71 per square foot. 706 Lakemont Ave is a home located in Summit County with nearby schools including Pfeiffer Elementary School, Kenmore Garfield Community Learning Center, and St. Bernard-St. Mary Elementary School.
Ownership History
Date
Name
Owned For
Owner Type
Purchase Details
Closed on
Mar 19, 2007
Sold by
Aegis Mortgage Corp
Bought by
Hornish David and Hornish Kara R
Current Estimated Value
Home Financials for this Owner
Home Financials are based on the most recent Mortgage that was taken out on this home.
Original Mortgage
$30,600
Outstanding Balance
$18,572
Interest Rate
6.31%
Mortgage Type
Purchase Money Mortgage
Estimated Equity
$77,308
Purchase Details
Closed on
Aug 21, 2006
Sold by
Cyphers David F
Bought by
Aegis Mortgage Corp
Purchase Details
Closed on
Dec 19, 2005
Sold by
Cyphers David
Bought by
Varga James W and 706 Lakemont Ave Residential Land Trust
Purchase Details
Closed on
Apr 28, 1995
Sold by
Hanna Anthony C
Bought by
Cyphers David F
Home Financials for this Owner
Home Financials are based on the most recent Mortgage that was taken out on this home.
Original Mortgage
$49,400
Interest Rate
8.42%
Mortgage Type
New Conventional
Create a Home Valuation Report for This Property
The Home Valuation Report is an in-depth analysis detailing your home's value as well as a comparison with similar homes in the area
Home Values in the Area
Average Home Value in this Area
Purchase History
| Date | Buyer | Sale Price | Title Company |
|---|---|---|---|
| Hornish David | $36,000 | Nova Title Agency Inc | |
| Aegis Mortgage Corp | $48,000 | None Available | |
| Varga James W | -- | None Available | |
| Cyphers David F | $52,000 | -- |
Source: Public Records
Mortgage History
| Date | Status | Borrower | Loan Amount |
|---|---|---|---|
| Open | Hornish David | $30,600 | |
| Previous Owner | Cyphers David F | $49,400 |
Source: Public Records
Tax History Compared to Growth
Tax History
| Year | Tax Paid | Tax Assessment Tax Assessment Total Assessment is a certain percentage of the fair market value that is determined by local assessors to be the total taxable value of land and additions on the property. | Land | Improvement |
|---|---|---|---|---|
| 2025 | $1,501 | $25,753 | $4,970 | $20,783 |
| 2024 | $1,429 | $25,753 | $4,970 | $20,783 |
| 2023 | $1,501 | $25,753 | $4,970 | $20,783 |
| 2022 | $1,303 | $18,358 | $3,427 | $14,931 |
| 2021 | $1,304 | $18,358 | $3,427 | $14,931 |
| 2020 | $1,286 | $18,360 | $3,430 | $14,930 |
| 2019 | $1,338 | $17,400 | $4,060 | $13,340 |
| 2018 | $1,321 | $17,400 | $4,060 | $13,340 |
| 2017 | $1,430 | $17,400 | $4,060 | $13,340 |
| 2016 | $1,431 | $18,620 | $4,060 | $14,560 |
| 2015 | $1,430 | $18,620 | $4,060 | $14,560 |
| 2014 | $1,419 | $18,620 | $4,060 | $14,560 |
| 2013 | $1,555 | $20,950 | $4,060 | $16,890 |
Source: Public Records
Map
Nearby Homes
- 754 Russell Ave
- 710 Clearview Ave
- 0 East Ave
- 738 Longview Ave
- 1174 La Croix Ave
- 828 Marie Ave
- 853 Russell Ave
- 815 Sheridan St
- 1574 East Ave
- 788 Saxon Ave
- 741 Jason Ave
- 905 National Ave
- 923 Rosamond Ave
- 1637 East Ave Unit 1639
- 702 W Thornton St
- 545 Thelma Ave
- 543 Thelma Ave
- 539 Thelma Ave
- 940 Lakewood Blvd
- 1326 Pontiac Ave
- 704 Lakemont Ave
- 700 Lakemont Ave
- 1485 Hillcrest St
- 1470 Hillcrest St
- 1474 Hillcrest St
- 1480 Hillcrest St
- 694 Lakemont Ave
- 1491 Hillcrest St
- 1484 Hillcrest St
- 1442 Hite St
- 695 Lakemont Ave
- 1438 Hite St
- 1488 Hillcrest St
- 1446 Hite St
- 1493 Hillcrest St
- 689 Lakemont Ave
- 1492 Hillcrest St
- 1450 Hite St
- 1497 Hillcrest St
- 682 Lakemont Ave