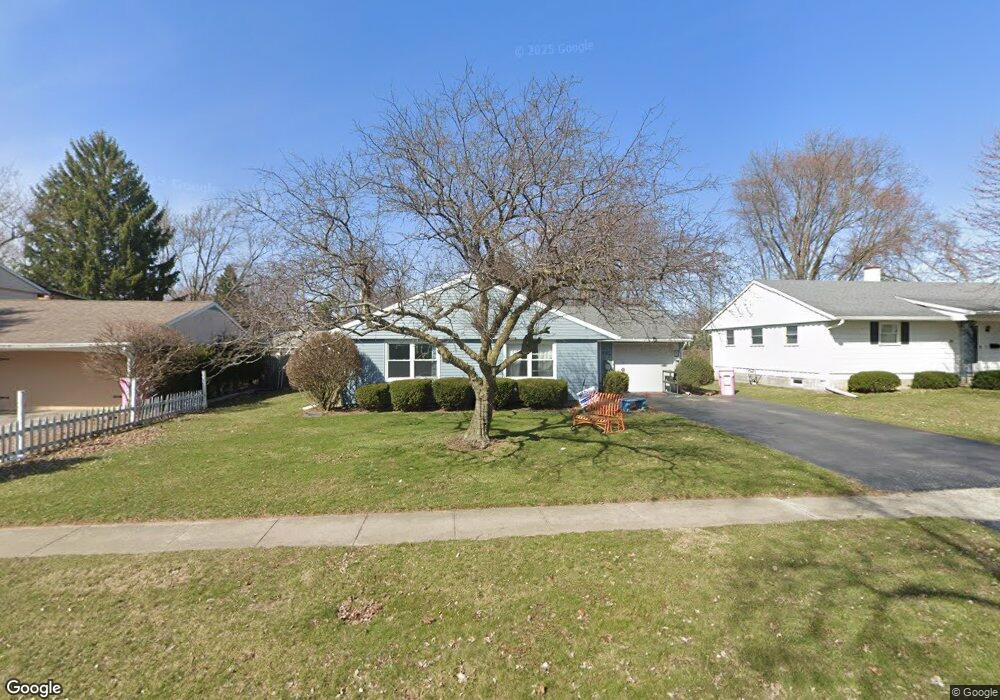
706 Lesa Ave Findlay, OH 45840
Estimated Value: $176,000 - $207,000
3
Beds
2
Baths
1,275
Sq Ft
$151/Sq Ft
Est. Value
About This Home
This home is located at 706 Lesa Ave, Findlay, OH 45840 and is currently estimated at $192,222, approximately $150 per square foot. 706 Lesa Ave is a home located in Hancock County with nearby schools including Whittier Primary School, Bigelow Hill Elementary School, and Glenwood Middle School.
Ownership History
Date
Name
Owned For
Owner Type
Purchase Details
Closed on
Feb 24, 2005
Sold by
Ammons Darrin L and Smith Ammons Bobbie Jo
Bought by
Eddington David A and Eddington Luella
Current Estimated Value
Home Financials for this Owner
Home Financials are based on the most recent Mortgage that was taken out on this home.
Original Mortgage
$100,325
Interest Rate
5.8%
Mortgage Type
FHA
Purchase Details
Closed on
Sep 26, 2000
Sold by
Foltz Betty M
Bought by
Ammons Darrin L and Smith Bobbi Jo
Home Financials for this Owner
Home Financials are based on the most recent Mortgage that was taken out on this home.
Original Mortgage
$71,760
Interest Rate
8.05%
Mortgage Type
New Conventional
Purchase Details
Closed on
Sep 18, 1989
Bought by
Foltz Betty M
Purchase Details
Closed on
Sep 15, 1987
Bought by
Foltz David O and Foltz Betty M
Create a Home Valuation Report for This Property
The Home Valuation Report is an in-depth analysis detailing your home's value as well as a comparison with similar homes in the area
Home Values in the Area
Average Home Value in this Area
Purchase History
| Date | Buyer | Sale Price | Title Company |
|---|---|---|---|
| Eddington David A | $101,900 | -- | |
| Ammons Darrin L | $89,700 | -- | |
| Foltz Betty M | -- | -- | |
| Foltz David O | $53,000 | -- |
Source: Public Records
Mortgage History
| Date | Status | Borrower | Loan Amount |
|---|---|---|---|
| Previous Owner | Eddington David A | $100,325 | |
| Previous Owner | Ammons Darrin L | $71,760 |
Source: Public Records
Tax History Compared to Growth
Tax History
| Year | Tax Paid | Tax Assessment Tax Assessment Total Assessment is a certain percentage of the fair market value that is determined by local assessors to be the total taxable value of land and additions on the property. | Land | Improvement |
|---|---|---|---|---|
| 2024 | $1,513 | $42,590 | $7,790 | $34,800 |
| 2023 | $1,515 | $42,590 | $7,790 | $34,800 |
| 2022 | $1,510 | $42,590 | $7,790 | $34,800 |
| 2021 | $1,464 | $35,960 | $7,800 | $28,160 |
| 2020 | $1,463 | $35,960 | $7,800 | $28,160 |
| 2019 | $1,434 | $35,960 | $7,800 | $28,160 |
| 2018 | $1,359 | $31,270 | $6,780 | $24,490 |
| 2017 | $680 | $31,270 | $6,780 | $24,490 |
| 2016 | $1,347 | $31,270 | $6,780 | $24,490 |
| 2015 | $1,151 | $26,330 | $6,780 | $19,550 |
| 2014 | $1,151 | $26,330 | $6,780 | $19,550 |
| 2012 | $1,289 | $29,260 | $6,780 | $22,480 |
Source: Public Records
Map
Nearby Homes
- 715 Christina Ct
- 1908 Gayle Ln
- 600 Charles Ave
- 420 Allen Ave
- 0 Sheridan Ave
- 1010 Brenda Ct
- 1062 Vincent St
- 716 Winfield Ave
- 1825 Pershing St
- 1865 Breckenridge Rd
- 230 Midland Ave
- 2100 Candlewick Dr
- 1736 Woodridge Crescent
- 206 Midland Ave
- 1216 Concord Ct
- 1820 N Main St
- 1928 Deer Ridge Dr
- 1928 Deer Ridge Dr Unit L-133
- 115 George St
- 1934 Geffs Ave
- 700 Lesa Ave
- 712 Lesa Ave
- 1815 Glenwood St
- 718 Lesa Ave
- 1819 Glenwood St
- 707 Lesa Ave
- 713 Lesa Ave
- 701 Lesa Ave
- 1901 Glenwood St
- 719 Lesa Ave
- 1804 Glenwood St
- 1800 Glenwood St
- 1800 Jennifer Ln
- 1804 Jennifer Ln
- 1812 Glenwood St
- 1911 Glenwood St
- 1808 Jennifer Ln
- 725 Lesa Ave
- 1816 Glenwood St
- 1915 Glenwood St