706 Myrtle St Waukegan, IL 60085
Estimated Value: $188,000 - $245,000
2
Beds
2
Baths
1,232
Sq Ft
$180/Sq Ft
Est. Value
About This Home
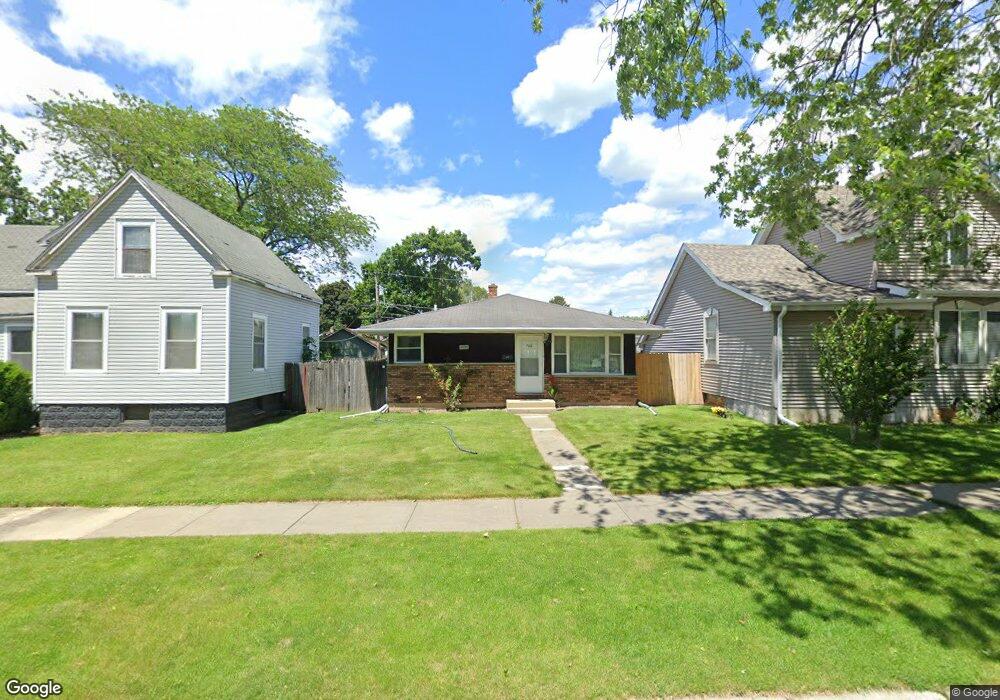
This home is located at 706 Myrtle St, Waukegan, IL 60085 and is currently estimated at $222,202, approximately $180 per square foot. 706 Myrtle St is a home located in Lake County with nearby schools including Glen Flora Elementary School, Edith M Smith Middle School, and Waukegan High School.
Ownership History
Date
Name
Owned For
Owner Type
Purchase Details
Closed on
Jun 18, 2018
Sold by
Martinez Ana Marie B
Bought by
Trust No 706 and Martinez
Current Estimated Value
Purchase Details
Closed on
Oct 7, 2017
Sold by
Martinez Edwin V and Martinez Felix B
Bought by
Martinez Ana Marie B
Purchase Details
Closed on
Dec 28, 2006
Sold by
Martinez Jaime and Martinez Maria
Bought by
Martinez Isaac
Purchase Details
Closed on
Jan 16, 1999
Sold by
Martinez Felix B and Martinez Isaac
Bought by
Martinez Jaime and Martinez Maria
Create a Home Valuation Report for This Property
The Home Valuation Report is an in-depth analysis detailing your home's value as well as a comparison with similar homes in the area
Home Values in the Area
Average Home Value in this Area
Purchase History
| Date | Buyer | Sale Price | Title Company |
|---|---|---|---|
| Trust No 706 | -- | None Listed On Document | |
| Martinez Ana Marie B | -- | Attorney | |
| Martinez Isaac | -- | None Available | |
| Martinez Jaime | $30,000 | -- |
Source: Public Records
Tax History Compared to Growth
Tax History
| Year | Tax Paid | Tax Assessment Tax Assessment Total Assessment is a certain percentage of the fair market value that is determined by local assessors to be the total taxable value of land and additions on the property. | Land | Improvement |
|---|---|---|---|---|
| 2024 | $5,426 | $57,327 | $7,281 | $50,046 |
| 2023 | $5,426 | $65,539 | $6,519 | $59,020 |
| 2022 | $5,474 | $61,998 | $6,200 | $55,798 |
| 2021 | $4,941 | $53,396 | $5,530 | $47,866 |
| 2020 | $4,959 | $49,745 | $5,152 | $44,593 |
| 2019 | $4,938 | $45,583 | $4,721 | $40,862 |
| 2018 | $6,153 | $46,355 | $6,015 | $40,340 |
| 2017 | $5,834 | $41,012 | $5,322 | $35,690 |
| 2016 | $5,507 | $35,638 | $4,625 | $31,013 |
| 2015 | $5,388 | $31,896 | $4,139 | $27,757 |
| 2014 | $4,513 | $26,674 | $4,599 | $22,075 |
| 2012 | $5,593 | $28,899 | $4,983 | $23,916 |
Source: Public Records
Map
Nearby Homes
- 918 N Ash St
- 620 N Poplar St
- 702 Franklin St
- 917 N Linden Ave
- 1110 N Ash St
- 1122 N Ash St
- 522 N Poplar St
- 415 W Ridgeland Ave
- 511 Chestnut St
- 428 N Poplar St
- 1000 Pine St
- 325 4th St
- 1105 Woodlawn Cir
- 452 North Ave
- 824 N Butrick St
- 723 N County St
- 1335 Chestnut St
- 1336 N Ash St
- 217 Stewart Ave
- 509 N Butrick St