Estimated Value: $165,000 - $192,000
2
Beds
1
Bath
864
Sq Ft
$200/Sq Ft
Est. Value
About This Home
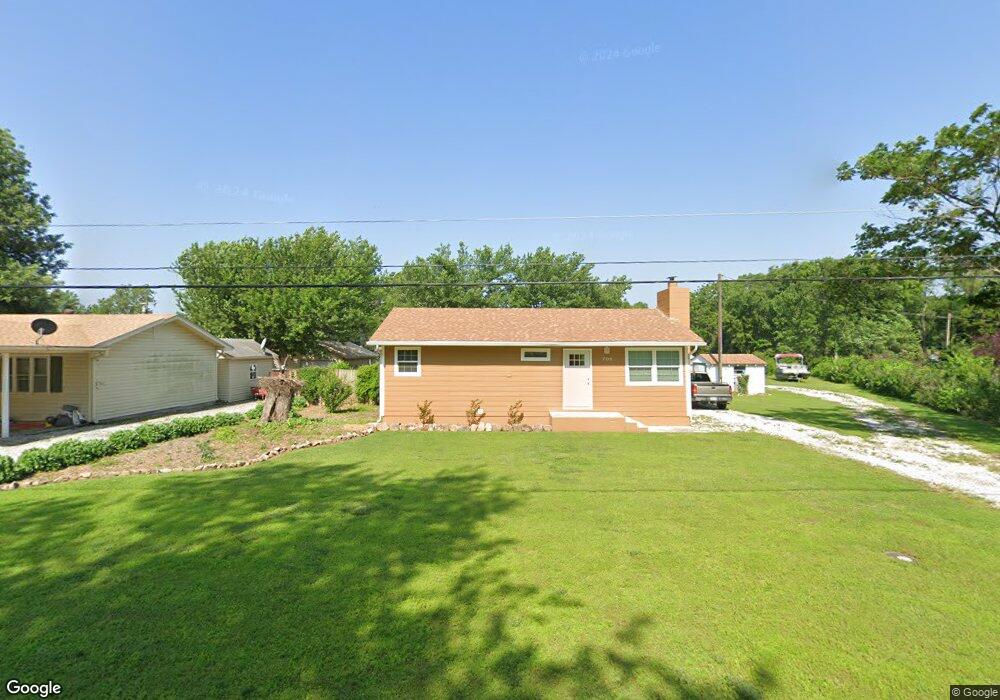
This home is located at 706 N 36th St, Grove, OK 74344 and is currently estimated at $173,003, approximately $200 per square foot. 706 N 36th St is a home located in Delaware County with nearby schools including Grove Lower Elementary School, Grove Upper Elementary School, and Grove Middle School.
Ownership History
Date
Name
Owned For
Owner Type
Purchase Details
Closed on
Nov 28, 2006
Sold by
Shandklin Christopher E and Shandklin Panny S
Bought by
Curran Charles R and Curran Doris A
Current Estimated Value
Home Financials for this Owner
Home Financials are based on the most recent Mortgage that was taken out on this home.
Original Mortgage
$60,697
Outstanding Balance
$36,084
Interest Rate
6.3%
Mortgage Type
FHA
Estimated Equity
$136,919
Purchase Details
Closed on
May 10, 1999
Sold by
Klingler Michael Ray and Klingler Oseph
Purchase Details
Closed on
Apr 25, 1999
Sold by
Klingler Family Revoc Trust
Create a Home Valuation Report for This Property
The Home Valuation Report is an in-depth analysis detailing your home's value as well as a comparison with similar homes in the area
Home Values in the Area
Average Home Value in this Area
Purchase History
| Date | Buyer | Sale Price | Title Company |
|---|---|---|---|
| Curran Charles R | $61,500 | -- | |
| -- | -- | -- | |
| -- | -- | -- |
Source: Public Records
Mortgage History
| Date | Status | Borrower | Loan Amount |
|---|---|---|---|
| Open | Curran Charles R | $60,697 |
Source: Public Records
Tax History
| Year | Tax Paid | Tax Assessment Tax Assessment Total Assessment is a certain percentage of the fair market value that is determined by local assessors to be the total taxable value of land and additions on the property. | Land | Improvement |
|---|---|---|---|---|
| 2025 | $567 | $8,011 | $1,851 | $6,160 |
| 2024 | $549 | $7,777 | $1,797 | $5,980 |
| 2023 | $549 | $7,551 | $1,763 | $5,788 |
| 2022 | $529 | $7,551 | $1,757 | $5,794 |
| 2021 | $510 | $7,331 | $1,755 | $5,576 |
| 2020 | $501 | $7,118 | $1,758 | $5,360 |
| 2019 | $486 | $6,710 | $1,730 | $4,980 |
| 2018 | $468 | $6,709 | $1,734 | $4,975 |
| 2017 | $453 | $6,514 | $1,716 | $4,798 |
| 2016 | $437 | $6,141 | $1,668 | $4,473 |
| 2015 | $444 | $6,141 | $1,668 | $4,473 |
| 2014 | $446 | $6,141 | $1,668 | $4,473 |
Source: Public Records
Map
Nearby Homes
- 703 N 36th St
- TBD Red Bud Dr
- TBD N N
- TBD Sunrise Cir
- 1413 Orchard Dr
- 751 N 16th St
- 1426 Kings Place
- 827 Apple Dr
- 0 Hwy 59 & 16th St N
- 27505 S 614 Rd
- 27400 S 614 Rd
- 827 Chatsworth Dr
- 822 Chatsworth Dr
- 1 S 592
- 3 S 592
- 000 Highway 59 911 Address Tbd
- 0 Tbd Hwy 59 - 911 Address Tbd
- 1517 80th St
- 1518 80th St NW
- 2300 Lookout Ln
Your Personal Tour Guide
Ask me questions while you tour the home.