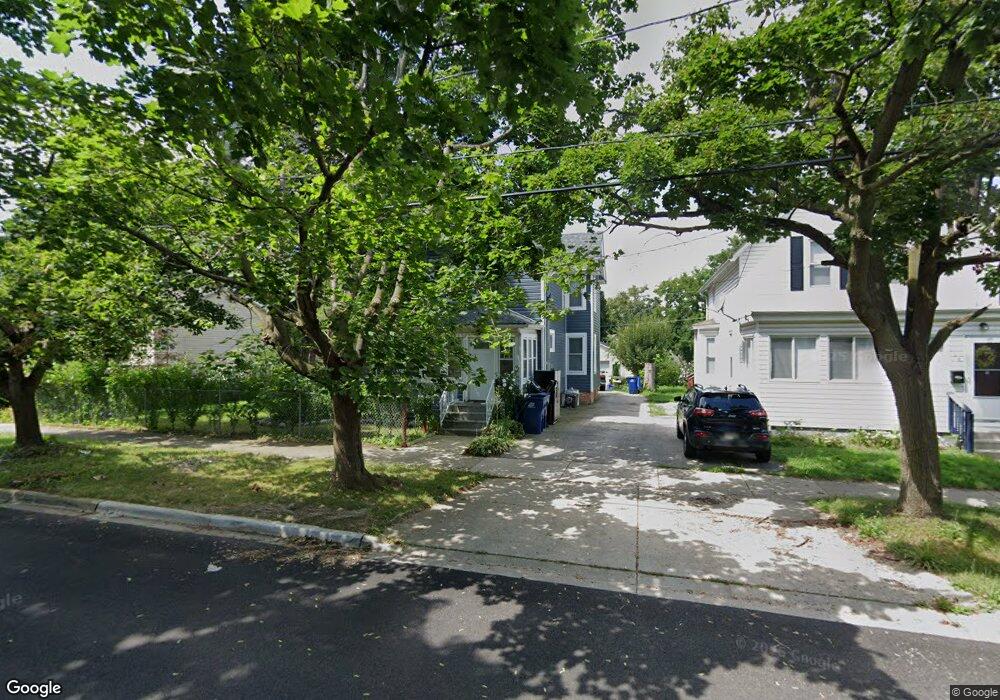
706 N Ash St Waukegan, IL 60085
Estimated Value: $202,000 - $264,000
4
Beds
2
Baths
1,464
Sq Ft
$161/Sq Ft
Est. Value
About This Home
This home is located at 706 N Ash St, Waukegan, IL 60085 and is currently estimated at $236,279, approximately $161 per square foot. 706 N Ash St is a home located in Lake County with nearby schools including Edith M Smith Middle School, Waukegan High School, and LEARN John & Kathy Schreiber Campus.
Ownership History
Date
Name
Owned For
Owner Type
Purchase Details
Closed on
Jan 17, 2020
Sold by
Padilla Daniel and Hernandez Esperanza
Bought by
Padilla Alondra and Padilla Katerine
Current Estimated Value
Purchase Details
Closed on
Aug 5, 2010
Sold by
Federal Home Loan Mortgage Corporation
Bought by
Padilla Daniel and Hernandez Esperanza
Purchase Details
Closed on
Feb 25, 2010
Sold by
Gomez
Bought by
Federal Home Loan Mortgage Corp
Purchase Details
Closed on
Jul 13, 2005
Sold by
Rivera David and Magana Raul
Bought by
Gomez Juana
Home Financials for this Owner
Home Financials are based on the most recent Mortgage that was taken out on this home.
Original Mortgage
$136,000
Interest Rate
7.25%
Mortgage Type
Fannie Mae Freddie Mac
Create a Home Valuation Report for This Property
The Home Valuation Report is an in-depth analysis detailing your home's value as well as a comparison with similar homes in the area
Home Values in the Area
Average Home Value in this Area
Purchase History
| Date | Buyer | Sale Price | Title Company |
|---|---|---|---|
| Padilla Alondra | -- | Attorney | |
| Padilla Daniel | $40,000 | First American Title | |
| Federal Home Loan Mortgage Corp | -- | None Available | |
| Gomez Juana | $170,000 | Ticor Title Insurance Compan |
Source: Public Records
Mortgage History
| Date | Status | Borrower | Loan Amount |
|---|---|---|---|
| Previous Owner | Gomez Juana | $136,000 |
Source: Public Records
Tax History Compared to Growth
Tax History
| Year | Tax Paid | Tax Assessment Tax Assessment Total Assessment is a certain percentage of the fair market value that is determined by local assessors to be the total taxable value of land and additions on the property. | Land | Improvement |
|---|---|---|---|---|
| 2024 | $4,688 | $64,097 | $13,092 | $51,005 |
| 2023 | $4,581 | $57,720 | $11,721 | $45,999 |
| 2022 | $4,581 | $52,855 | $11,253 | $41,602 |
| 2021 | $4,142 | $45,729 | $10,037 | $35,692 |
| 2020 | $4,149 | $42,602 | $9,351 | $33,251 |
| 2019 | $4,123 | $39,038 | $8,569 | $30,469 |
| 2018 | $4,028 | $36,348 | $10,916 | $25,432 |
| 2017 | $3,721 | $32,158 | $9,658 | $22,500 |
| 2016 | $3,391 | $27,944 | $8,392 | $19,552 |
| 2015 | $3,211 | $25,010 | $7,511 | $17,499 |
| 2014 | $2,797 | $22,069 | $5,061 | $17,008 |
| 2012 | $4,628 | $23,911 | $5,484 | $18,427 |
Source: Public Records
Map
Nearby Homes
- 620 N Poplar St
- 702 Franklin St
- 522 N Poplar St
- 918 N Ash St
- 511 Chestnut St
- 428 N Poplar St
- 452 North Ave
- 325 4th St
- 415 W Ridgeland Ave
- 917 N Linden Ave
- 1109 Massena Ave
- 1110 N Ash St
- 723 N County St
- 1122 N Ash St
- 611 N Genesee St
- 1000 Pine St
- 824 N Butrick St
- 509 N Butrick St
- 217 Stewart Ave
- 1105 Woodlawn Cir