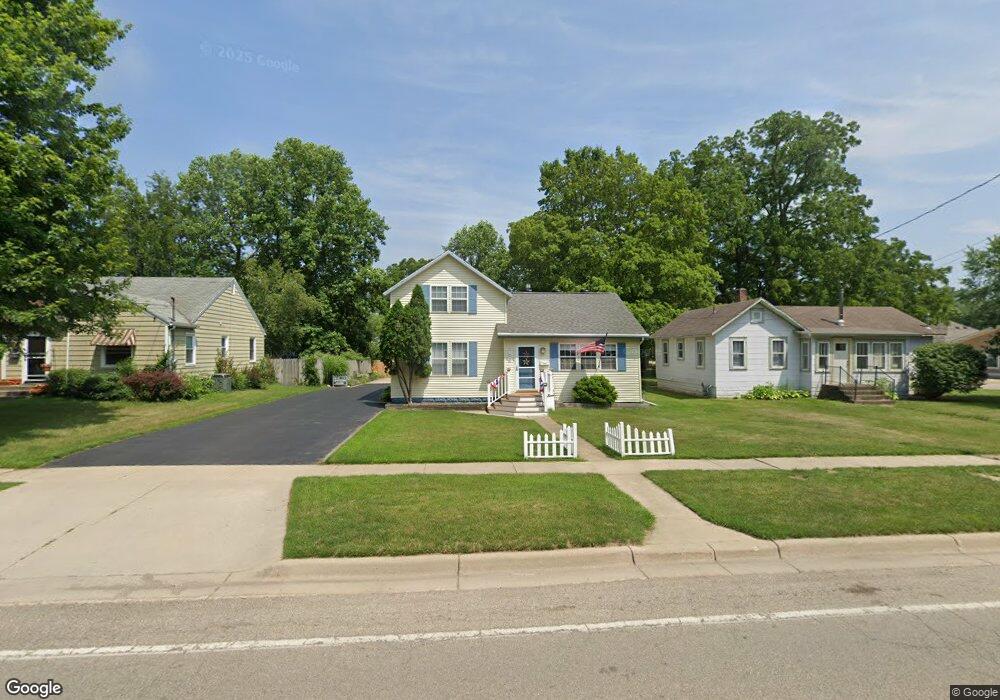
706 N Elm St Three Oaks, MI 49128
Estimated Value: $288,000 - $334,000
3
Beds
2
Baths
1,592
Sq Ft
$200/Sq Ft
Est. Value
About This Home
This home is located at 706 N Elm St, Three Oaks, MI 49128 and is currently estimated at $318,701, approximately $200 per square foot. 706 N Elm St is a home located in Berrien County with nearby schools including River Valley Middle/High School and Lutie High School.
Ownership History
Date
Name
Owned For
Owner Type
Purchase Details
Closed on
Jul 31, 2003
Sold by
Marsh Kelli Ranson
Bought by
Marsh David and Marsh Kelli
Current Estimated Value
Purchase Details
Closed on
Jul 8, 2003
Sold by
Ranson Mario A
Bought by
Marsh Kelli Ranson
Purchase Details
Closed on
Nov 26, 1997
Purchase Details
Closed on
Feb 3, 1997
Purchase Details
Closed on
Jun 30, 1986
Purchase Details
Closed on
Mar 28, 1986
Purchase Details
Closed on
Oct 15, 1985
Purchase Details
Closed on
Jul 1, 1983
Purchase Details
Closed on
Jul 1, 1978
Create a Home Valuation Report for This Property
The Home Valuation Report is an in-depth analysis detailing your home's value as well as a comparison with similar homes in the area
Home Values in the Area
Average Home Value in this Area
Purchase History
| Date | Buyer | Sale Price | Title Company |
|---|---|---|---|
| Marsh David | -- | -- | |
| Marsh Kelli Ranson | -- | -- | |
| -- | $86,000 | -- | |
| -- | $17,000 | -- | |
| -- | $16,000 | -- | |
| -- | $100 | -- | |
| -- | $22,600 | -- | |
| -- | $20,500 | -- | |
| -- | $9,500 | -- |
Source: Public Records
Tax History Compared to Growth
Tax History
| Year | Tax Paid | Tax Assessment Tax Assessment Total Assessment is a certain percentage of the fair market value that is determined by local assessors to be the total taxable value of land and additions on the property. | Land | Improvement |
|---|---|---|---|---|
| 2025 | $1,740 | $160,800 | $0 | $0 |
| 2024 | $1,918 | $135,900 | $0 | $0 |
| 2023 | $1,826 | $151,100 | $0 | $0 |
| 2022 | $1,755 | $126,400 | $0 | $0 |
| 2021 | $2,530 | $73,200 | $11,300 | $61,900 |
| 2020 | $2,367 | $67,300 | $0 | $0 |
| 2019 | $2,281 | $75,700 | $5,600 | $70,100 |
| 2018 | $2,558 | $75,700 | $0 | $0 |
| 2017 | $2,191 | $76,187 | $0 | $0 |
| 2016 | $2,148 | $74,747 | $0 | $0 |
| 2015 | $2,145 | $67,691 | $0 | $0 |
| 2014 | $671 | $61,632 | $0 | $0 |
Source: Public Records
Map
Nearby Homes
- 112 Butternut St
- 308 N Elm St
- 8 Poplar St
- 202 Poplar St
- 207 Cherry St
- 101 Sycamore St E
- 6513 Kruger Rd
- 201 Sycamore St E
- 114 Sycamore St E
- 103 Maple St
- 6690 Kruger Rd
- 202 Maple St
- 6974 U S 12
- 37 Huckleberry
- 5463 U S 12
- 7079 U S 12
- 7200 U S 12
- 404 Sherwood Ave
- 409 Oak St
- 0 W Elm Valley Rd Unit 25049923