Estimated Value: $320,000 - $344,000
Studio
1
Bath
2,189
Sq Ft
$152/Sq Ft
Est. Value
About This Home
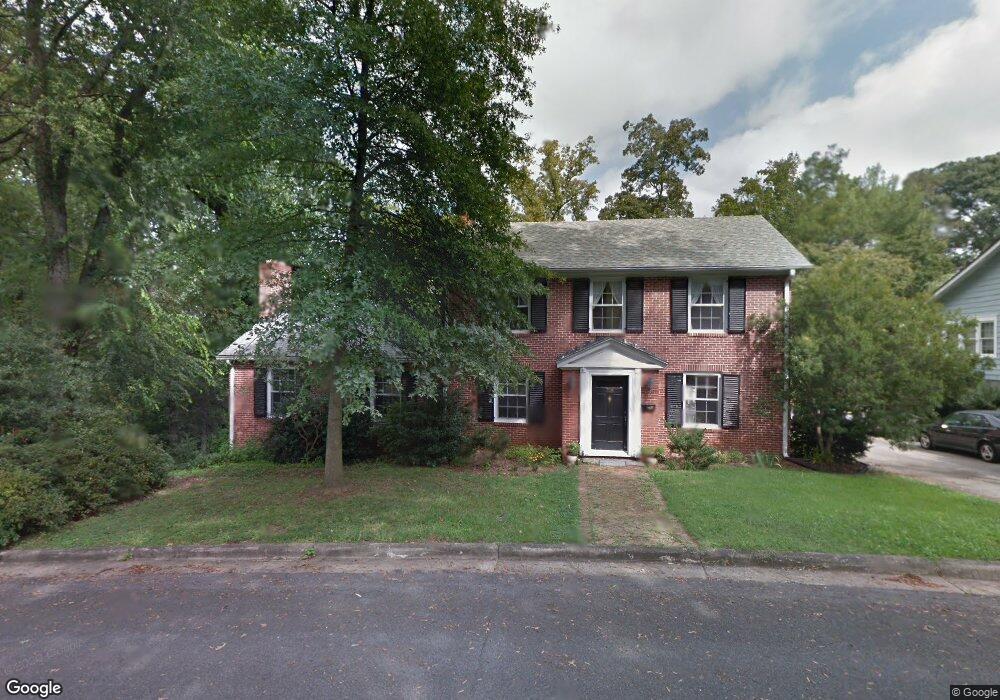
This home is located at 706 River Ave SW, Rome, GA 30161 and is currently estimated at $333,442, approximately $152 per square foot. 706 River Ave SW is a home located in Floyd County with nearby schools including Rome High School, St. Mary School, and Darlington School.
Ownership History
Date
Name
Owned For
Owner Type
Purchase Details
Closed on
Jul 28, 2009
Sold by
Conforti Barbara G
Bought by
Borer Catherine H
Current Estimated Value
Home Financials for this Owner
Home Financials are based on the most recent Mortgage that was taken out on this home.
Original Mortgage
$189,000
Outstanding Balance
$121,516
Interest Rate
5.26%
Mortgage Type
New Conventional
Estimated Equity
$211,926
Purchase Details
Closed on
Jan 29, 2007
Sold by
Not Provided
Bought by
Borer Catherine H and Miller Ronald W
Purchase Details
Closed on
Feb 21, 1992
Sold by
Huft Bryan J and Huft Jane
Bought by
Franklin Bradly J and Lori Anne Frank
Purchase Details
Closed on
Dec 24, 1980
Sold by
B U N C and Laura Hunter W
Bought by
Huft Bryan J and Huft Jane
Purchase Details
Closed on
Mar 11, 1978
Sold by
Hunter H F Mrs
Bought by
B U N C and Laura Hunter W
Purchase Details
Closed on
Jan 1, 1901
Bought by
Hunter H F Mrs
Create a Home Valuation Report for This Property
The Home Valuation Report is an in-depth analysis detailing your home's value as well as a comparison with similar homes in the area
Home Values in the Area
Average Home Value in this Area
Purchase History
| Date | Buyer | Sale Price | Title Company |
|---|---|---|---|
| Borer Catherine H | $210,000 | -- | |
| Borer Catherine H | $208,000 | -- | |
| Franklin Bradly J | $80,000 | -- | |
| Huft Bryan J | $58,500 | -- | |
| B U N C | -- | -- | |
| Hunter H F Mrs | -- | -- |
Source: Public Records
Mortgage History
| Date | Status | Borrower | Loan Amount |
|---|---|---|---|
| Open | Borer Catherine H | $189,000 |
Source: Public Records
Tax History
| Year | Tax Paid | Tax Assessment Tax Assessment Total Assessment is a certain percentage of the fair market value that is determined by local assessors to be the total taxable value of land and additions on the property. | Land | Improvement |
|---|---|---|---|---|
| 2025 | $3,501 | $135,093 | $37,199 | $97,894 |
| 2024 | $3,501 | $124,596 | $33,817 | $90,779 |
| 2023 | $3,476 | $117,464 | $30,257 | $87,207 |
| 2022 | $3,122 | $97,954 | $24,918 | $73,036 |
| 2021 | $3,017 | $89,059 | $23,138 | $65,921 |
| 2020 | $2,885 | $80,176 | $17,798 | $62,378 |
| 2019 | $2,788 | $76,604 | $17,798 | $58,806 |
| 2018 | $2,657 | $73,061 | $17,798 | $55,263 |
| 2017 | $2,546 | $70,041 | $17,798 | $52,243 |
| 2016 | $2,501 | $68,640 | $17,760 | $50,880 |
| 2015 | $2,630 | $68,640 | $17,760 | $50,880 |
| 2014 | $2,630 | $68,640 | $17,760 | $50,880 |
Source: Public Records
Map
Nearby Homes
- 2 Coral Ave SW
- 801 Maple Ave SW
- 320 E 3rd Ave
- 209 Moultrie Ln SE
- 9 Eastridge Ct SW
- 1 E 11th St SW
- 166 E 11th St SW
- 803/805 Maple Ave SW
- 803/80 Maple Ave SW
- 162 E 11th St SE
- 1011 Walnut Ave SW
- 164 E 11th St SE
- 168 E 11th St SE
- 170 E 11th St SW
- 214 E 3rd St
- 31 Notasulga Dr SW
- 312 E 3rd St
- 3 Lookout Ave SW
- 29 Pear St
- 515 S Broad St SW
- 704 River Ave SW
- 705 River Ave SW
- 4 Coral Ave SW
- 700 River Ave SW
- 707 River Ave SW
- 608 River Ave SW
- 708 River Ave SW
- 708 River Ave SW
- 606 River Ave SW
- 3 Coral Ave SW
- 5 Coral Ave SW
- 1 Coral Ave SW
- 1 Queen St SW
- 8 Coral Ave SW
- 7 Coral Ave SW
- 9 Coral Ave SW
- 3 Queen St SW Unit 3A3B 5A5B
- 604 River Ave SW
- 308 E 6th St SW
- 306 E 6th St SW
Your Personal Tour Guide
Ask me questions while you tour the home.