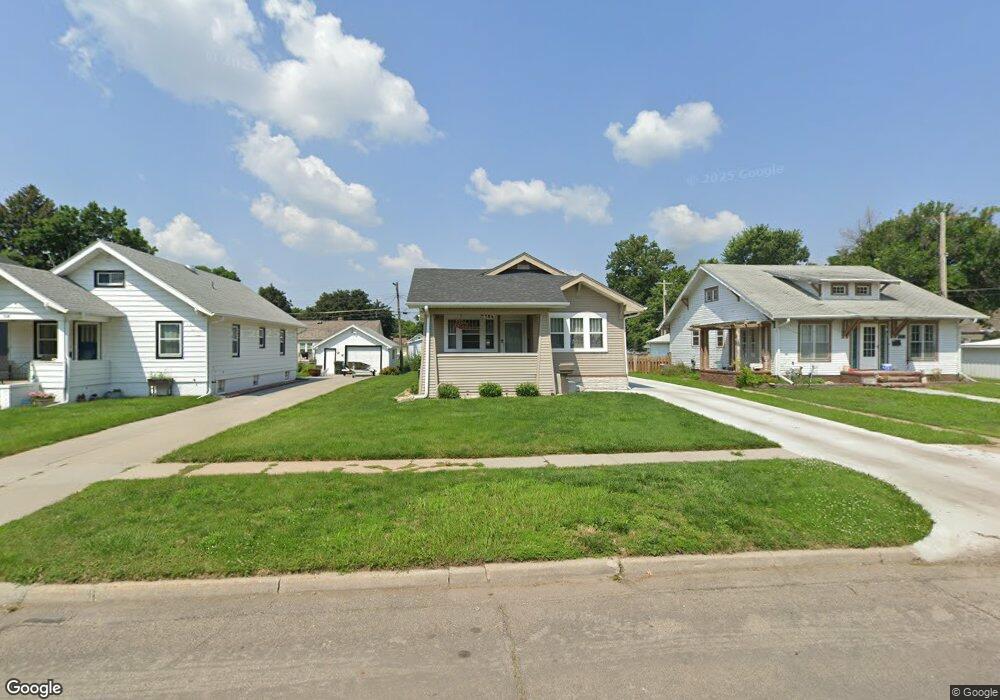
706 S 8th St Norfolk, NE 68701
Estimated Value: $202,000 - $225,000
2
Beds
2
Baths
1,244
Sq Ft
$172/Sq Ft
Est. Value
About This Home
This home is located at 706 S 8th St, Norfolk, NE 68701 and is currently estimated at $214,107, approximately $172 per square foot. 706 S 8th St is a home located in Madison County with nearby schools including Norfolk Senior High School, Christ Lutheran School, and Keystone Christian Academy.
Ownership History
Date
Name
Owned For
Owner Type
Purchase Details
Closed on
Sep 22, 2022
Sold by
Sullivan Stephanie L
Bought by
Sullivan Nicholas J
Current Estimated Value
Purchase Details
Closed on
Jun 10, 2013
Sold by
The Secretary Of Hud Of Washington Dc
Bought by
Herfel Alan and Herfel Naomi
Home Financials for this Owner
Home Financials are based on the most recent Mortgage that was taken out on this home.
Original Mortgage
$30,776
Interest Rate
3.38%
Mortgage Type
Purchase Money Mortgage
Purchase Details
Closed on
Mar 31, 2009
Sold by
Skoglund Charles S and Skoglund Louise K
Bought by
Dietz Casey
Home Financials for this Owner
Home Financials are based on the most recent Mortgage that was taken out on this home.
Original Mortgage
$51,727
Interest Rate
5.14%
Mortgage Type
FHA
Purchase Details
Closed on
Feb 18, 2009
Sold by
Skoglund Charles S and Skoglund Louise K
Bought by
Dietz Casey and Grace Joseph
Home Financials for this Owner
Home Financials are based on the most recent Mortgage that was taken out on this home.
Original Mortgage
$51,727
Interest Rate
5.14%
Mortgage Type
FHA
Create a Home Valuation Report for This Property
The Home Valuation Report is an in-depth analysis detailing your home's value as well as a comparison with similar homes in the area
Home Values in the Area
Average Home Value in this Area
Purchase History
| Date | Buyer | Sale Price | Title Company |
|---|---|---|---|
| Sullivan Nicholas J | -- | -- | |
| Herfel Alan | -- | None Available | |
| Dietz Casey | $52,682 | -- | |
| Dietz Casey | $29,812 | None Available |
Source: Public Records
Mortgage History
| Date | Status | Borrower | Loan Amount |
|---|---|---|---|
| Previous Owner | Herfel Alan | $30,776 | |
| Previous Owner | Dietz Casey | $51,727 |
Source: Public Records
Tax History Compared to Growth
Tax History
| Year | Tax Paid | Tax Assessment Tax Assessment Total Assessment is a certain percentage of the fair market value that is determined by local assessors to be the total taxable value of land and additions on the property. | Land | Improvement |
|---|---|---|---|---|
| 2024 | $2,321 | $186,866 | $8,321 | $178,545 |
| 2023 | $3,182 | $172,124 | $8,321 | $163,803 |
| 2022 | $2,865 | $154,574 | $8,321 | $146,253 |
| 2021 | $2,636 | $142,498 | $8,321 | $134,177 |
| 2020 | $2,424 | $131,419 | $8,321 | $123,098 |
| 2019 | $2,316 | $121,255 | $8,321 | $112,934 |
| 2018 | $2,019 | $107,491 | $6,657 | $100,834 |
| 2017 | $1,818 | $96,687 | $6,657 | $90,030 |
| 2016 | $1,687 | $89,525 | $6,164 | $83,361 |
| 2015 | $1,688 | $89,525 | $6,164 | $83,361 |
| 2014 | $1,661 | $85,555 | $6,164 | $79,391 |
| 2013 | $1,610 | $80,361 | $6,164 | $74,197 |
Source: Public Records
Map
Nearby Homes
- 705 S 10th St
- 602 S 10th St
- 805 S 5th St
- 918 S 5th St
- 906 S 4th St
- 410 W Michigan Ave
- 603 S 4th St
- 404 S 12th St
- 706 Columbia St
- 1217 Hayes Ave
- 700 S 2nd St
- 3306 W Michigan Ave
- 3206 W Michigan Ave
- 3205 W Michigan Ave
- 3307 W Michigan Ave
- 1208 W Phillip Ave
- 922 S 2nd St
- 103 S 13th Place
- 1204 W Madison Ave
- 1312 Hayes Ave