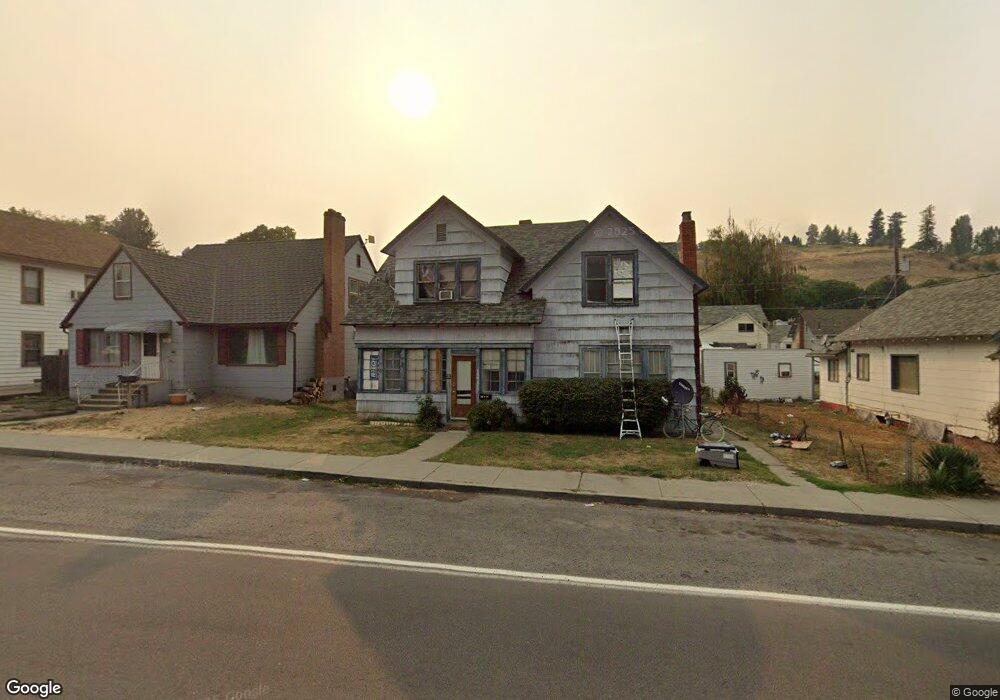
706 S Main St Colfax, WA 99111
Estimated Value: $237,593 - $331,000
2
Beds
2
Baths
1,820
Sq Ft
$158/Sq Ft
Est. Value
About This Home
This home is located at 706 S Main St, Colfax, WA 99111 and is currently estimated at $287,398, approximately $157 per square foot. 706 S Main St is a home located in Whitman County with nearby schools including Leonard M. Jennings Elementary School and Colfax High School.
Create a Home Valuation Report for This Property
The Home Valuation Report is an in-depth analysis detailing your home's value as well as a comparison with similar homes in the area
Home Values in the Area
Average Home Value in this Area
Tax History
| Year | Tax Paid | Tax Assessment Tax Assessment Total Assessment is a certain percentage of the fair market value that is determined by local assessors to be the total taxable value of land and additions on the property. | Land | Improvement |
|---|---|---|---|---|
| 2025 | $1,428 | $109,058 | $11,385 | $97,673 |
| 2024 | $1,374 | $99,880 | $9,900 | $89,980 |
| 2023 | $1,490 | $99,880 | $9,900 | $89,980 |
| 2022 | $1,474 | $99,880 | $9,900 | $89,980 |
| 2021 | $1,427 | $99,880 | $9,900 | $89,980 |
| 2020 | $1,460 | $99,880 | $9,900 | $89,980 |
| 2019 | $1,370 | $99,880 | $9,900 | $89,980 |
| 2018 | $1,479 | $99,880 | $9,900 | $89,980 |
| 2017 | $1,243 | $99,880 | $9,900 | $89,980 |
| 2016 | $1,374 | $99,880 | $9,900 | $89,980 |
| 2015 | $1,336 | $99,880 | $9,900 | $89,980 |
| 2014 | -- | $91,700 | $9,900 | $81,800 |
Source: Public Records
Map
Nearby Homes
- 108 E Wawawai St
- 905 S East St
- 408 S Mill St
- 311 E Cooper St
- 1002 S Mill St
- 317 E Fairview St
- 701 W Fairview St
- 610 S I St
- 900 S Hillcrest Dr Unit 306
- 712 S Hillcrest Dr
- TBD N Cherry St
- 203 N Mill St Unit 304
- 203 N Mill St Unit 307
- 719 E Southview Ave
- 705 W Orchard St
- 502 N Mill St
- 305 Ledbetter Ct
- 508 N Deanway St
- 1601 Cedar St
- 1804 Cedar St
Your Personal Tour Guide
Ask me questions while you tour the home.