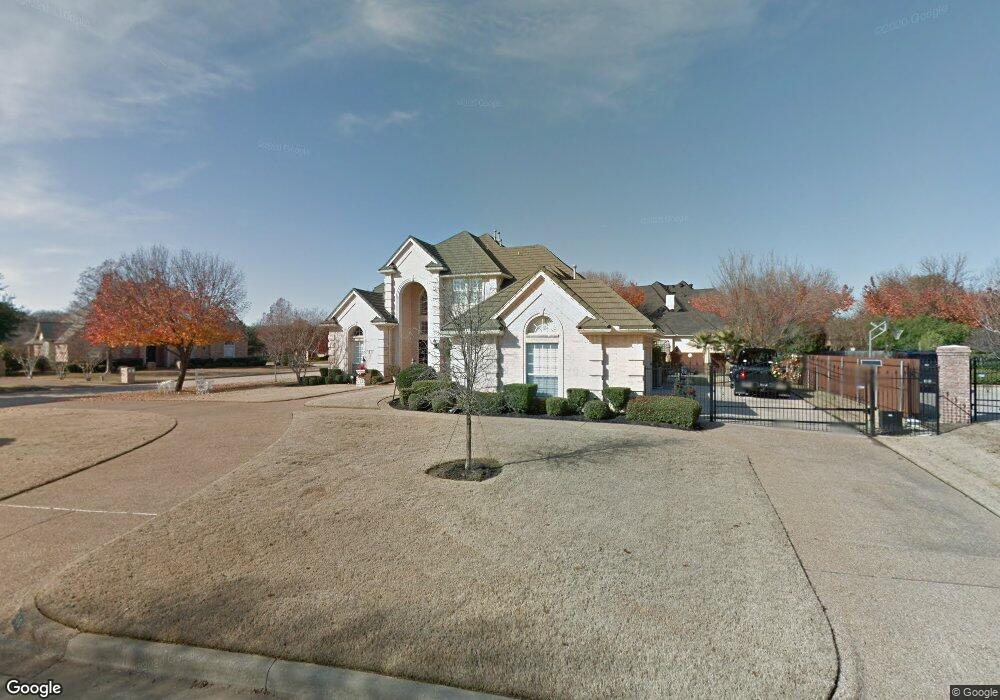
706 Sutton Mill Ct Southlake, TX 76092
Estimated Value: $1,120,000 - $1,438,000
5
Beds
5
Baths
3,749
Sq Ft
$351/Sq Ft
Est. Value
About This Home
This home is located at 706 Sutton Mill Ct, Southlake, TX 76092 and is currently estimated at $1,315,556, approximately $350 per square foot. 706 Sutton Mill Ct is a home located in Tarrant County with nearby schools including Carroll Elementary School, Eubanks Intermediate School, and George Dawson Middle School.
Ownership History
Date
Name
Owned For
Owner Type
Purchase Details
Closed on
Aug 19, 2014
Sold by
Anderson Roger and Anderson Pamela
Bought by
Haider Ronald J and Haider Patricia J
Current Estimated Value
Home Financials for this Owner
Home Financials are based on the most recent Mortgage that was taken out on this home.
Original Mortgage
$417,000
Outstanding Balance
$318,910
Interest Rate
4.19%
Mortgage Type
New Conventional
Estimated Equity
$996,646
Purchase Details
Closed on
May 30, 1995
Sold by
Stanley Custom Homes Inc
Bought by
Anderson Roger and Anderson Pamela
Home Financials for this Owner
Home Financials are based on the most recent Mortgage that was taken out on this home.
Original Mortgage
$340,000
Interest Rate
10%
Create a Home Valuation Report for This Property
The Home Valuation Report is an in-depth analysis detailing your home's value as well as a comparison with similar homes in the area
Home Values in the Area
Average Home Value in this Area
Purchase History
| Date | Buyer | Sale Price | Title Company |
|---|---|---|---|
| Haider Ronald J | -- | None Available | |
| Anderson Roger | -- | Rattikin Title Co |
Source: Public Records
Mortgage History
| Date | Status | Borrower | Loan Amount |
|---|---|---|---|
| Open | Haider Ronald J | $417,000 | |
| Previous Owner | Anderson Roger | $340,000 |
Source: Public Records
Tax History Compared to Growth
Tax History
| Year | Tax Paid | Tax Assessment Tax Assessment Total Assessment is a certain percentage of the fair market value that is determined by local assessors to be the total taxable value of land and additions on the property. | Land | Improvement |
|---|---|---|---|---|
| 2025 | $20,620 | $1,066,000 | $349,350 | $716,650 |
| 2024 | $20,620 | $1,179,000 | $349,350 | $829,650 |
| 2023 | $18,227 | $1,000,000 | $349,350 | $650,650 |
| 2022 | $20,977 | $972,324 | $232,900 | $739,424 |
| 2021 | $14,803 | $649,269 | $232,900 | $416,369 |
| 2020 | $13,696 | $595,829 | $209,610 | $386,219 |
| 2019 | $16,829 | $695,000 | $175,000 | $520,000 |
| 2018 | $14,749 | $609,075 | $150,000 | $459,075 |
| 2017 | $15,355 | $619,513 | $150,000 | $469,513 |
| 2016 | $15,572 | $628,270 | $150,000 | $478,270 |
| 2015 | $13,243 | $547,500 | $65,000 | $482,500 |
| 2014 | $13,243 | $547,500 | $65,000 | $482,500 |
Source: Public Records
Map
Nearby Homes
- 900 Kingsbury Way
- 1196 W Continental Blvd
- 802 Princeton Ct
- 7607 Monticello Pkwy
- 7702 Tillman Hill Rd
- 1206 Oakwood Trail
- 608 Stratford Dr
- 1002 Chimney Hill Trail
- 7511 Mount Vernon Dr
- 800 Woodcrest Ct
- 806 Shadow Glen Dr
- 7400 John Mccain Rd
- 305 Canyon Lake Dr
- 1205 Scenic Dr
- 806 Ridgedale Ct
- 7212 John Mccain Rd
- 7312 Hix Ct
- 205 Edinburgh Ct
- 1227 Strathmore Dr
- 305 Sheffield Dr
- 704 Sutton Mill Ct
- 800 Potomac Place
- 705 Potomac Place
- 703 Potomac Place
- 608 Potomac Place
- 703 Prince George Ct
- 701 Potomac Place
- 802 Potomac Place
- 801 Potomac Place
- 702 Sutton Mill Ct
- 607 Potomac Place
- 701 Prince George Ct
- 604 Potomac Place
- 803 Potomac Place
- 701 Sutton Mill Ct
- 605 Potomac Place
- 700 Sutton Mill Ct
- 605 Vicksburg Ct
- 704 Prince George Ct
- 706 Prince George Ct