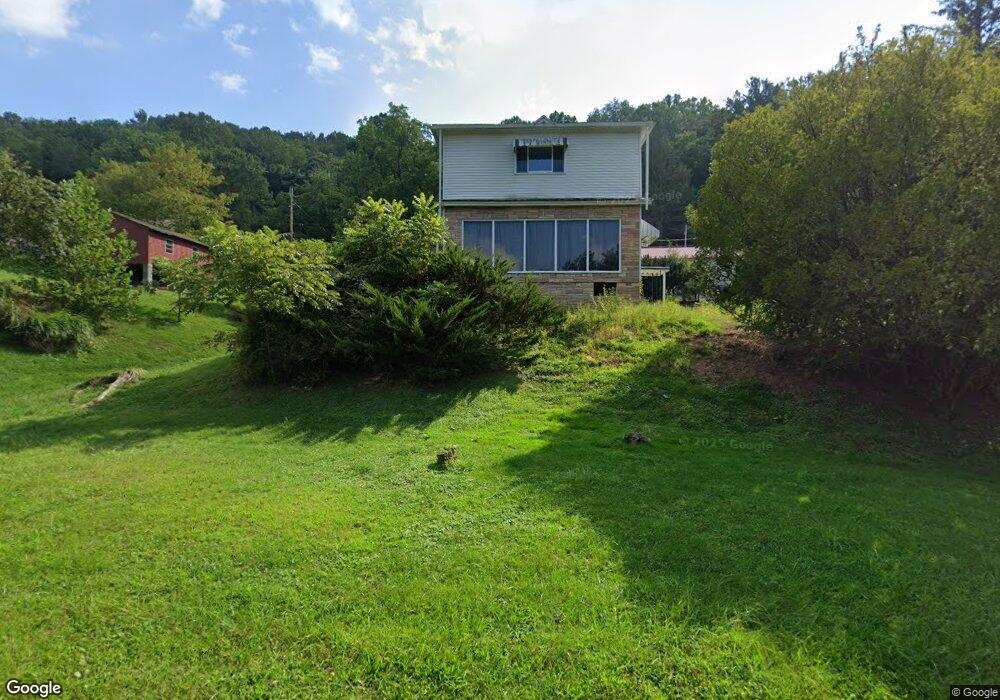
706 Sycamore Ave Mannington, WV 26582
Estimated Value: $151,000 - $176,000
3
Beds
1
Bath
1,519
Sq Ft
$105/Sq Ft
Est. Value
About This Home
This home is located at 706 Sycamore Ave, Mannington, WV 26582 and is currently estimated at $160,249, approximately $105 per square foot. 706 Sycamore Ave is a home located in Marion County with nearby schools including Mannington Middle School, Blackshere Elementary School, and North Marion High School.
Ownership History
Date
Name
Owned For
Owner Type
Purchase Details
Closed on
Jul 9, 2022
Sold by
Unknown
Bought by
Griffin Elizabeth
Current Estimated Value
Home Financials for this Owner
Home Financials are based on the most recent Mortgage that was taken out on this home.
Original Mortgage
$105,000
Outstanding Balance
$99,730
Interest Rate
5.23%
Mortgage Type
New Conventional
Estimated Equity
$60,519
Purchase Details
Closed on
Jul 8, 2022
Sold by
Lee Ice Ii Robert
Bought by
Liggett Kirsten Brooke
Home Financials for this Owner
Home Financials are based on the most recent Mortgage that was taken out on this home.
Original Mortgage
$105,000
Outstanding Balance
$99,730
Interest Rate
5.23%
Mortgage Type
New Conventional
Estimated Equity
$60,519
Purchase Details
Closed on
Sep 7, 2018
Sold by
Wilson James E and Wilson Samuel L
Bought by
Ice Robert Lee and Ice Kirsten Brooke
Home Financials for this Owner
Home Financials are based on the most recent Mortgage that was taken out on this home.
Original Mortgage
$87,290
Interest Rate
4.5%
Create a Home Valuation Report for This Property
The Home Valuation Report is an in-depth analysis detailing your home's value as well as a comparison with similar homes in the area
Home Values in the Area
Average Home Value in this Area
Purchase History
| Date | Buyer | Sale Price | Title Company |
|---|---|---|---|
| Griffin Elizabeth | $135,000 | Sansalone & Sansalone | |
| Griffin Elizabeth | $135,000 | None Listed On Document | |
| Liggett Kirsten Brooke | -- | Sansalone & Sansalone | |
| Ice Robert Lee | $97,000 | None Available |
Source: Public Records
Mortgage History
| Date | Status | Borrower | Loan Amount |
|---|---|---|---|
| Open | Griffin Elizabeth | $105,000 | |
| Closed | Griffin Elizabeth | $105,000 | |
| Previous Owner | Ice Robert Lee | $87,290 |
Source: Public Records
Tax History Compared to Growth
Tax History
| Year | Tax Paid | Tax Assessment Tax Assessment Total Assessment is a certain percentage of the fair market value that is determined by local assessors to be the total taxable value of land and additions on the property. | Land | Improvement |
|---|---|---|---|---|
| 2025 | $1,100 | $74,340 | $21,300 | $53,040 |
| 2024 | $1,100 | $72,240 | $21,300 | $50,940 |
| 2023 | $1,068 | $65,880 | $21,300 | $44,580 |
| 2022 | $898 | $60,360 | $23,520 | $36,840 |
| 2021 | $861 | $58,500 | $23,520 | $34,980 |
| 2020 | $832 | $56,340 | $23,100 | $33,240 |
| 2019 | $672 | $44,760 | $13,740 | $31,020 |
| 2018 | $709 | $47,520 | $14,220 | $33,300 |
| 2017 | $390 | $46,440 | $13,740 | $32,700 |
| 2016 | $375 | $45,600 | $13,980 | $31,620 |
| 2015 | $404 | $46,560 | $16,320 | $30,240 |
| 2014 | $404 | $47,580 | $17,760 | $29,820 |
Source: Public Records
Map
Nearby Homes
- 1008 E Main St
- TBD Highland St
- 221 Meadow Ave
- 0 Marshall St
- 300 Adams St
- 403 James St
- 413 W Main St
- TBD Pyles Ave
- 63 Broomfield St
- Lot 2 E Run Cir
- 223 Dudley Fork Rd
- TBD Brush Run
- 3012 Main St
- 3203 Willey Ave
- 3113 Jenkins Ln
- Lot 1 State Fork Rd
- 57 Chatham Hill
- 2869 Odells Knob Rd
- TBD Helens Run Rd
- 00 Helens Run Rd
- 722 Mulberry Ave
- 706 Mulberry Ave
- 708 Mulberry Ave
- 704 Mulberry Ave
- 721 Sycamore Ave
- 612 Sycamore Ave
- 714 Mulberry Ave
- 608 Mulberry Ave
- 704 Holly Ave
- 704 Holly Ave
- 702 Willow St
- 609 Sycamore Ave
- 723 Sycamore Ave
- 120 Sycamore Ave
- 608 Sycamore Ave
- 710 Holly Ave
- 719 Holly Ave
- 606 Sycamore Ave
- 724 Sycamore Ave
- 607 Sycamore Ave