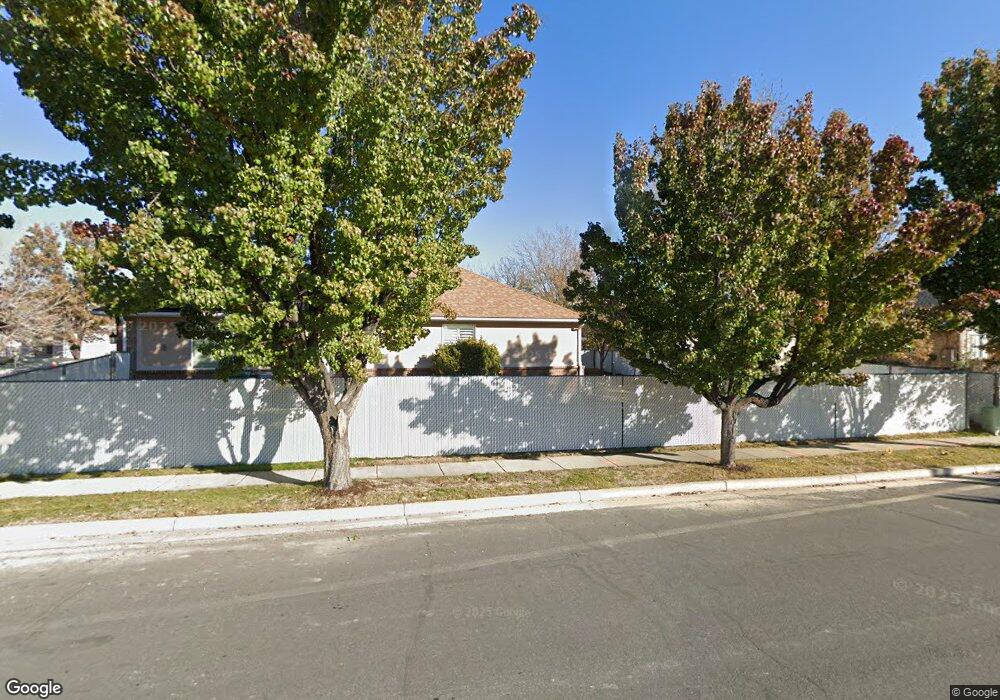
706 W 2275 N Layton, UT 84041
Estimated Value: $547,000 - $574,000
3
Beds
3
Baths
1,584
Sq Ft
$354/Sq Ft
Est. Value
About This Home
This home is located at 706 W 2275 N, Layton, UT 84041 and is currently estimated at $560,996, approximately $354 per square foot. 706 W 2275 N is a home located in Davis County with nearby schools including Lincoln Elementary School, North Layton Junior High School, and Northridge High School.
Ownership History
Date
Name
Owned For
Owner Type
Purchase Details
Closed on
Jun 7, 2022
Sold by
Jepson Craig T and Jepson Delores R
Bought by
Craig T Jepson And Delores R Jepson Revocable
Current Estimated Value
Purchase Details
Closed on
Aug 10, 2017
Sold by
Christensen Davis R and Christensen Hanne L
Bought by
Jepson Craig T and Jepson Delores R
Home Financials for this Owner
Home Financials are based on the most recent Mortgage that was taken out on this home.
Original Mortgage
$260,000
Interest Rate
3.88%
Mortgage Type
New Conventional
Purchase Details
Closed on
May 1, 2003
Sold by
Vockel Steve G and Vockel Lorraine H
Bought by
Christensen Davis R and Christensen Hanne L
Home Financials for this Owner
Home Financials are based on the most recent Mortgage that was taken out on this home.
Original Mortgage
$137,000
Interest Rate
5.02%
Purchase Details
Closed on
Aug 27, 1996
Sold by
Willow Bend Inc
Bought by
Vockel Steve G and Vockel Lorraine H
Create a Home Valuation Report for This Property
The Home Valuation Report is an in-depth analysis detailing your home's value as well as a comparison with similar homes in the area
Home Values in the Area
Average Home Value in this Area
Purchase History
| Date | Buyer | Sale Price | Title Company |
|---|---|---|---|
| Craig T Jepson And Delores R Jepson Revocable | -- | None Listed On Document | |
| Jepson Craig T | -- | Mountain America Title | |
| Christensen Davis R | -- | Mountain View Title & Escrow | |
| Vockel Steve G | -- | Mountain View Title |
Source: Public Records
Mortgage History
| Date | Status | Borrower | Loan Amount |
|---|---|---|---|
| Previous Owner | Jepson Craig T | $260,000 | |
| Previous Owner | Christensen Davis R | $137,000 |
Source: Public Records
Tax History
| Year | Tax Paid | Tax Assessment Tax Assessment Total Assessment is a certain percentage of the fair market value that is determined by local assessors to be the total taxable value of land and additions on the property. | Land | Improvement |
|---|---|---|---|---|
| 2025 | $2,667 | $279,950 | $99,966 | $179,984 |
| 2024 | $2,554 | $270,050 | $116,295 | $153,755 |
| 2023 | $2,640 | $492,000 | $136,544 | $355,456 |
| 2022 | $2,728 | $276,100 | $72,703 | $203,397 |
| 2021 | $2,504 | $378,000 | $103,344 | $274,656 |
| 2020 | $2,279 | $330,000 | $86,382 | $243,618 |
| 2019 | $2,200 | $312,000 | $81,522 | $230,478 |
| 2018 | $2,023 | $288,000 | $81,522 | $206,478 |
| 2016 | $1,580 | $141,351 | $26,417 | $114,934 |
| 2015 | $1,845 | $128,646 | $26,417 | $102,229 |
| 2014 | $1,472 | $129,788 | $26,417 | $103,371 |
| 2013 | -- | $130,439 | $26,884 | $103,555 |
Source: Public Records
Map
Nearby Homes
- 579 W 2350 N
- 820 W 2350 N
- 2149 N 750 W
- 2236 N 525 W
- 506 W 2200 N
- 498 W 2200 N
- 2246 N 475 W
- 2234 N 450 W
- 2214 N 450 W
- 1012 W 2525 N
- 2298 N 1085 W
- 2320 N 1085 W
- 1155 W 2200 N
- 2875 N Hill Field Rd Unit 17
- 2875 N Hill Field Rd Unit 199
- 2875 N Hill Field Rd Unit 29
- 2600 N Hill Field Rd Unit 134
- 2600 N Hill Field Rd Unit 4
- 61 Sunset Dr
- 58 Sunset Dr
- 2276 N 725 W
- 2295 N 650 W
- 2295 N 675 W
- 2286 N 725 W
- 2313 N 675 W
- 709 W 2275 N
- 1102 W 2325 N Unit 32
- 1095 W 2325 N Unit 30
- 1103 W 2325 N Unit 29
- 1115 W 2325 N Unit 28
- 1123 W 2325 N Unit 27
- 1143 W 2325 N Unit 25
- 1114 W 2325 N
- 1122 W 2325 N Unit 34
- 695 W 2275 N
- 723 W 2275 N
- 2288 N 725 W
- 2277 N 725 W
- 683 W 2275 N
- 735 W 2275 N
Your Personal Tour Guide
Ask me questions while you tour the home.