706 W Creek Dr Dripping Springs, TX 78620
Sunset Canyon NeighborhoodEstimated Value: $638,896 - $790,000
4
Beds
2
Baths
2,280
Sq Ft
$321/Sq Ft
Est. Value
About This Home
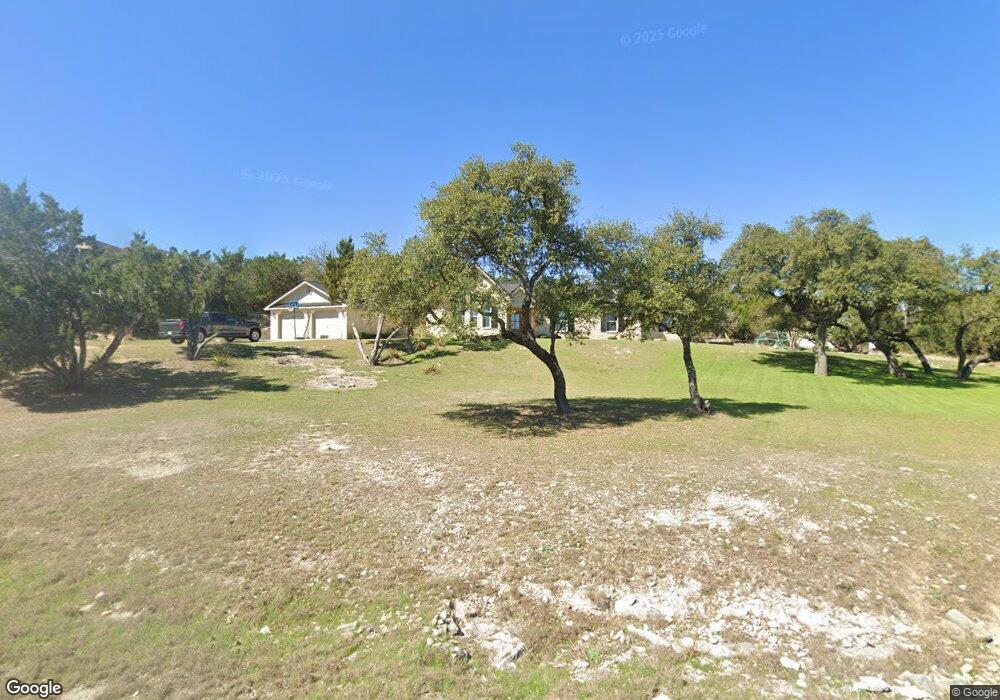
This home is located at 706 W Creek Dr, Dripping Springs, TX 78620 and is currently estimated at $732,974, approximately $321 per square foot. 706 W Creek Dr is a home located in Hays County with nearby schools including Dripping Springs Middle School, Dripping Springs High School, and Aesa Prep Academy.
Ownership History
Date
Name
Owned For
Owner Type
Purchase Details
Closed on
May 21, 2015
Sold by
Roberts Cody
Bought by
Tracy Breca
Current Estimated Value
Purchase Details
Closed on
Aug 28, 2007
Sold by
Rundstedt Ronald J and Rundstedt Tina
Bought by
Tracy Breca and Roberts Cody
Home Financials for this Owner
Home Financials are based on the most recent Mortgage that was taken out on this home.
Original Mortgage
$275,152
Interest Rate
6.5%
Mortgage Type
Purchase Money Mortgage
Purchase Details
Closed on
Jul 27, 2005
Sold by
Mortgage Electronic Registration Systems
Bought by
Bank Of New York
Purchase Details
Closed on
Jul 20, 2005
Sold by
Mortgage Electronic Registration Systems
Bought by
Bank Of New York and Cwabs 2004-02
Purchase Details
Closed on
May 3, 2005
Sold by
Smith Teryl G and Smith Delani
Bought by
Mortgage Electronic Registration Systems
Purchase Details
Closed on
Aug 14, 2000
Sold by
Kennedy Abel G
Bought by
Tracy Breca
Create a Home Valuation Report for This Property
The Home Valuation Report is an in-depth analysis detailing your home's value as well as a comparison with similar homes in the area
Home Values in the Area
Average Home Value in this Area
Purchase History
| Date | Buyer | Sale Price | Title Company |
|---|---|---|---|
| Tracy Breca | -- | None Available | |
| Tracy Breca | -- | None Available | |
| Bank Of New York | -- | First American Title | |
| Rundstedt Ronald J | -- | First American Title | |
| Bank Of New York | -- | -- | |
| Mortgage Electronic Registration Systems | $207,110 | -- | |
| Tracy Breca | -- | -- |
Source: Public Records
Mortgage History
| Date | Status | Borrower | Loan Amount |
|---|---|---|---|
| Previous Owner | Tracy Breca | $275,152 |
Source: Public Records
Tax History Compared to Growth
Tax History
| Year | Tax Paid | Tax Assessment Tax Assessment Total Assessment is a certain percentage of the fair market value that is determined by local assessors to be the total taxable value of land and additions on the property. | Land | Improvement |
|---|---|---|---|---|
| 2025 | $7,964 | $639,353 | -- | -- |
| 2024 | $7,964 | $581,230 | $273,170 | $308,060 |
| 2023 | $8,763 | $580,316 | $314,140 | $582,460 |
| 2022 | $8,998 | $527,560 | $117,180 | $625,950 |
| 2021 | $8,973 | $479,600 | $117,180 | $362,420 |
| 2020 | $7,838 | $437,940 | $79,140 | $358,800 |
| 2019 | $8,298 | $402,391 | $76,670 | $347,920 |
| 2018 | $7,586 | $365,810 | $62,820 | $302,990 |
| 2017 | $7,469 | $357,440 | $62,820 | $294,620 |
| 2016 | $7,024 | $336,180 | $62,820 | $273,360 |
| 2015 | $5,987 | $315,440 | $67,760 | $247,680 |
Source: Public Records
Map
Nearby Homes
- 13326 Trautwein Rd
- 504 Roy Creek Ln
- 508 N Canyonwood Dr
- 318 Silver Sage Ct
- 288 Silver Sage Ct
- 1014 Hidden Hills Dr
- TBD Hidden Hills Dr
- 13601 Paisano Cir
- 4 Midnight Sky Dr
- 1011 Oak Meadow Dr
- 1036 Hazy Hills Loop
- 5 Midnight Sky Dr
- 301 Sea Hero Place
- 13601 Paisano Trail
- 13400 Paisano Trail
- 13590 Paisano Trail
- 258 Cactus Wren Ct
- 488 Iron Willow Loop
- 791 Hazy Hills Loop
- 156 Sea Hero Place
- 704 W Creek Dr
- 705 W Creek Dr
- 711 Blue Hills Dr
- 707 Blue Hills Dr
- 700 W Creek Dr
- 703 W Creek Dr
- 709 W Creek Dr
- 711 W Creek Dr
- 701 W Creek Dr
- 710 Blue Hills Dr
- 708 Blue Hills Dr
- 607 W Creek Dr
- 607 W Creek Dr
- 703 Upland Dr
- 706 Blue Hills Dr
- 704 Blue Hills Dr
- 714 Blue Hills Dr
- TBD Upland Dr
- 706 Cottonwood Creek Rd
- 708 Upland Dr