706 Waukegan Rd Unit C407 Glenview, IL 60025
Estimated Value: $384,840 - $440,000
3
Beds
--
Bath
51,458
Sq Ft
$8/Sq Ft
Est. Value
About This Home
This home is located at 706 Waukegan Rd Unit C407, Glenview, IL 60025 and is currently estimated at $413,210, approximately $8 per square foot. 706 Waukegan Rd Unit C407 is a home located in Cook County with nearby schools including Lyon Elementary School, Pleasant Ridge Elementary School, and Springman Middle School.
Ownership History
Date
Name
Owned For
Owner Type
Purchase Details
Closed on
May 1, 2003
Sold by
Midwest Bank & Trust Co
Bought by
Berry Richard M and Berry Jane D
Current Estimated Value
Home Financials for this Owner
Home Financials are based on the most recent Mortgage that was taken out on this home.
Original Mortgage
$208,900
Interest Rate
5.78%
Mortgage Type
Purchase Money Mortgage
Purchase Details
Closed on
Aug 15, 1998
Sold by
Penny John L and Penny Lucille F
Bought by
Midwest Trust Services Inc and Trust #97-3-7274
Purchase Details
Closed on
May 21, 1998
Sold by
Swenson Neva B and Swenson Neva Lee
Bought by
Penny John L and Penny Lucille F
Home Financials for this Owner
Home Financials are based on the most recent Mortgage that was taken out on this home.
Original Mortgage
$150,000
Interest Rate
7.27%
Purchase Details
Closed on
Aug 1, 1994
Sold by
Swenson Gerald R
Bought by
Swenson Neva Lee
Create a Home Valuation Report for This Property
The Home Valuation Report is an in-depth analysis detailing your home's value as well as a comparison with similar homes in the area
Home Values in the Area
Average Home Value in this Area
Purchase History
| Date | Buyer | Sale Price | Title Company |
|---|---|---|---|
| Berry Richard M | $369,000 | -- | |
| Berry Richard M | $369,000 | -- | |
| Midwest Trust Services Inc | -- | -- | |
| Penny John L | $270,000 | Chicago Title Insurance Co | |
| Swenson Neva Lee | -- | -- |
Source: Public Records
Mortgage History
| Date | Status | Borrower | Loan Amount |
|---|---|---|---|
| Previous Owner | Berry Richard M | $208,900 | |
| Previous Owner | Penny John L | $150,000 |
Source: Public Records
Tax History Compared to Growth
Tax History
| Year | Tax Paid | Tax Assessment Tax Assessment Total Assessment is a certain percentage of the fair market value that is determined by local assessors to be the total taxable value of land and additions on the property. | Land | Improvement |
|---|---|---|---|---|
| 2024 | $5,662 | $31,550 | $1,911 | $29,639 |
| 2023 | $5,462 | $31,550 | $1,911 | $29,639 |
| 2022 | $5,462 | $31,550 | $1,911 | $29,639 |
| 2021 | $5,109 | $26,520 | $1,463 | $25,057 |
| 2020 | $5,149 | $26,520 | $1,463 | $25,057 |
| 2019 | $5,352 | $31,831 | $1,463 | $30,368 |
| 2018 | $6,126 | $26,634 | $1,284 | $25,350 |
| 2017 | $4,602 | $26,634 | $1,284 | $25,350 |
| 2016 | $4,728 | $26,634 | $1,284 | $25,350 |
| 2015 | $3,553 | $19,415 | $1,045 | $18,370 |
| 2014 | $3,509 | $19,415 | $1,045 | $18,370 |
| 2013 | $3,379 | $19,415 | $1,045 | $18,370 |
Source: Public Records
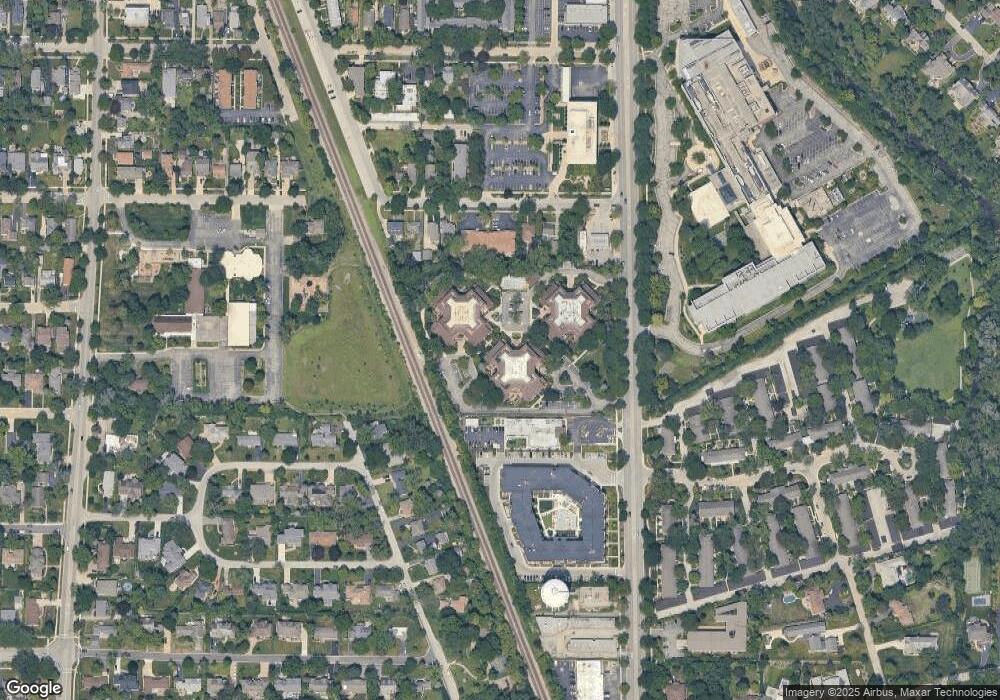
Map
Nearby Homes
- 711 Carriage Hill Dr
- 713 Carriage Hill Dr
- 609 Carriage Hill Dr
- 601 Carriage Hill Dr
- 1800 Dewes St Unit 305
- 1800 Dewes St Unit 201
- 1821 George Ct
- 1123 Longvalley Rd
- 1121 Longvalley Rd
- 245 Nora Ave
- 315 Lincoln St
- 1220 Depot St Unit 305
- 1220 Depot St Unit 109
- 1220 Depot St Unit 409
- 1752 Maclean Ct
- 2137 Glenview Rd
- 517 Briarhill Ln
- 1125 Longvalley Rd
- 809 Lenox Rd
- 1342 Pine St
- 706 Waukegan Rd Unit 7C
- 706 Waukegan Rd Unit C404
- 706 Waukegan Rd Unit C403
- 706 Waukegan Rd Unit C202
- 706 Waukegan Rd Unit C3
- 706 Waukegan Rd Unit C6
- 706 Waukegan Rd Unit C308
- 706 Waukegan Rd Unit C302
- 706 Waukegan Rd Unit C307
- 706 Waukegan Rd Unit C303
- 706 Waukegan Rd Unit C408
- 706 Waukegan Rd Unit C5
- 706 Waukegan Rd Unit C203
- 706 Waukegan Rd Unit C2
- 706 Waukegan Rd Unit C406
- 706 Waukegan Rd Unit C405
- 706 Waukegan Rd Unit C101
- 706 Waukegan Rd Unit C1
- 706 Waukegan Rd Unit C7
- 706 Waukegan Rd Unit C401