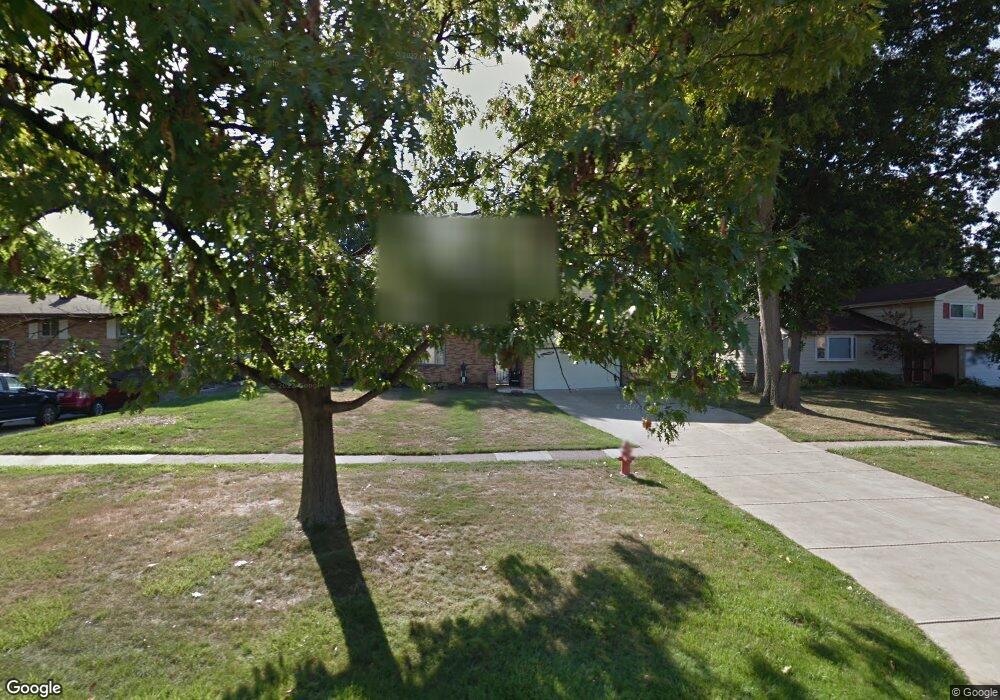
7061 Middlebrook Blvd Middleburg Heights, OH 44130
Estimated Value: $331,305 - $354,000
4
Beds
3
Baths
2,109
Sq Ft
$164/Sq Ft
Est. Value
About This Home
This home is located at 7061 Middlebrook Blvd, Middleburg Heights, OH 44130 and is currently estimated at $345,576, approximately $163 per square foot. 7061 Middlebrook Blvd is a home located in Cuyahoga County with nearby schools including Big Creek Elementary School, Berea-Midpark Middle School, and Berea-Midpark High School.
Ownership History
Date
Name
Owned For
Owner Type
Purchase Details
Closed on
Oct 25, 1996
Sold by
Zupancic Timothy I
Bought by
Mctaggart Kevin M and Mctaggart Linda M
Current Estimated Value
Home Financials for this Owner
Home Financials are based on the most recent Mortgage that was taken out on this home.
Original Mortgage
$103,000
Outstanding Balance
$9,803
Interest Rate
7.7%
Mortgage Type
New Conventional
Estimated Equity
$335,773
Purchase Details
Closed on
May 31, 1995
Sold by
Vecchio Arthur A
Bought by
Zupancic Timothy I
Home Financials for this Owner
Home Financials are based on the most recent Mortgage that was taken out on this home.
Original Mortgage
$93,600
Interest Rate
8.26%
Mortgage Type
New Conventional
Purchase Details
Closed on
Aug 1, 1989
Sold by
Kehn Frank A and Kehn Virginia F
Bought by
Vecchio Arthur A
Purchase Details
Closed on
Jan 1, 1975
Bought by
Kehn Frank A and Kehn Virginia F
Create a Home Valuation Report for This Property
The Home Valuation Report is an in-depth analysis detailing your home's value as well as a comparison with similar homes in the area
Home Values in the Area
Average Home Value in this Area
Purchase History
| Date | Buyer | Sale Price | Title Company |
|---|---|---|---|
| Mctaggart Kevin M | $131,000 | -- | |
| Zupancic Timothy I | $117,000 | -- | |
| Vecchio Arthur A | $107,000 | -- | |
| Kehn Frank A | -- | -- |
Source: Public Records
Mortgage History
| Date | Status | Borrower | Loan Amount |
|---|---|---|---|
| Open | Mctaggart Kevin M | $103,000 | |
| Previous Owner | Zupancic Timothy I | $93,600 |
Source: Public Records
Tax History Compared to Growth
Tax History
| Year | Tax Paid | Tax Assessment Tax Assessment Total Assessment is a certain percentage of the fair market value that is determined by local assessors to be the total taxable value of land and additions on the property. | Land | Improvement |
|---|---|---|---|---|
| 2024 | $4,852 | $92,190 | $15,645 | $76,545 |
| 2023 | $4,328 | $67,730 | $12,850 | $54,880 |
| 2022 | $4,299 | $67,730 | $12,850 | $54,880 |
| 2021 | $4,275 | $67,730 | $12,850 | $54,880 |
| 2020 | $4,189 | $58,380 | $11,060 | $47,320 |
| 2019 | $4,070 | $166,800 | $31,600 | $135,200 |
| 2018 | $4,054 | $58,380 | $11,060 | $47,320 |
| 2017 | $3,968 | $52,720 | $10,190 | $42,530 |
| 2016 | $3,937 | $52,720 | $10,190 | $42,530 |
| 2015 | $3,708 | $52,720 | $10,190 | $42,530 |
| 2014 | $3,708 | $52,720 | $10,190 | $42,530 |
Source: Public Records
Map
Nearby Homes
- 16475 Heather Ln Unit S202
- 6689 Fry Rd
- 6809 Meadow Ln
- 7221 Craigmere Dr
- V/L Franke Rd
- 16761 Orchard Grove Dr Unit 6808A
- 7254 Craigmere Dr
- 6736 Columbine Ct
- 6736 Rockridge Ct
- 7280 Pearl Rd
- 6710 Woodruff Ct
- 6724 Benedict Dr
- 6744 Benedict Dr
- 6720 Benedict Dr
- 6748 Benedict Dr
- 7364 Pearl Rd
- 6749 Middlebrook Blvd
- 15861 Glenridge Ave
- 6771 Wood Creek Dr
- 16365 Barriemore Ave
- 7055 Middlebrook Blvd
- 7067 Middlebrook Blvd
- 7049 Middlebrook Blvd
- 7073 Middlebrook Blvd
- 7062 Elise Dr
- 7060 Elise Dr
- 7068 Elise Dr
- 7074 Elise Dr
- 7043 Middlebrook Blvd
- 7079 Middlebrook Blvd
- 7068 Middlebrook Blvd
- 7056 Middlebrook Blvd
- 7058 Elise Dr
- 7074 Middlebrook Blvd
- 7078 Elise Dr
- 7050 Middlebrook Blvd
- 7062 Middlebrook Blvd
- 7037 Middlebrook Blvd
- 7085 Middlebrook Blvd
- 7042 Middlebrook Blvd