Estimated Value: $290,985 - $308,000
3
Beds
2
Baths
1,391
Sq Ft
$216/Sq Ft
Est. Value
About This Home
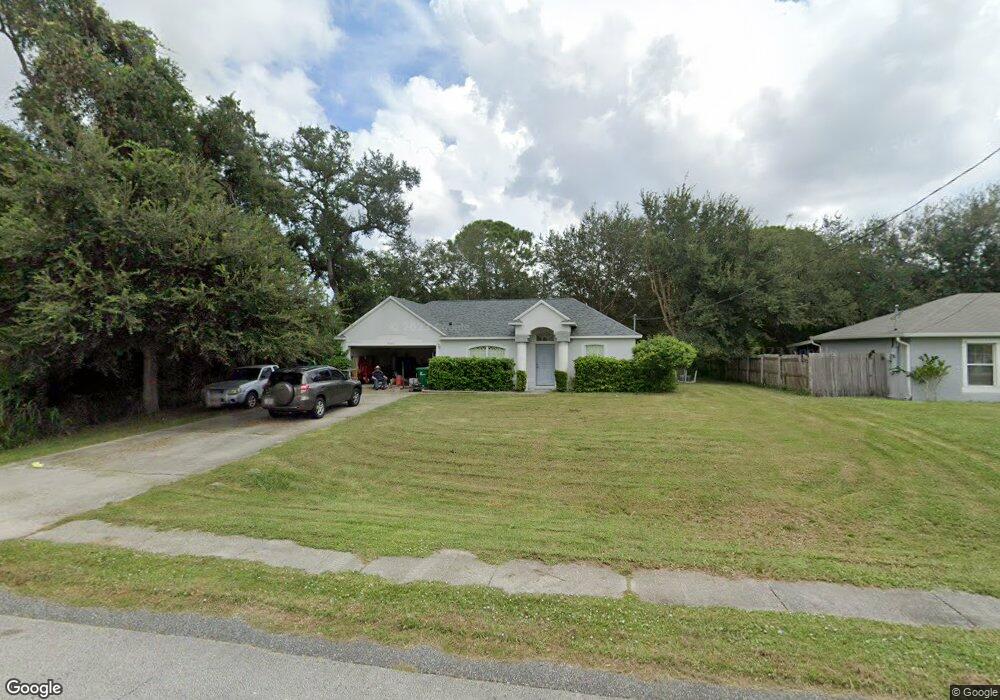
This home is located at 7065 Song Dr, Cocoa, FL 32927 and is currently estimated at $300,996, approximately $216 per square foot. 7065 Song Dr is a home located in Brevard County with nearby schools including Atlantis Elementary School, Space Coast Junior/Senior High School, and East Atlantic Prep of Brevard County.
Ownership History
Date
Name
Owned For
Owner Type
Purchase Details
Closed on
Apr 23, 2014
Sold by
Lombardo John and Estate Of Teresa Lombardo
Bought by
Lombardo John
Current Estimated Value
Purchase Details
Closed on
Jan 16, 2013
Sold by
Corcoran Lori and Teresa Lombardo Revocable Trus
Bought by
Lombardo Teresa
Purchase Details
Closed on
Jun 27, 2012
Sold by
Lombardo Teri
Bought by
Corcoran Lori J and Teresa Lombardo Revocable Trus
Purchase Details
Closed on
Mar 30, 2005
Sold by
Mercedes Homes Inc
Bought by
Lombardo Teri
Purchase Details
Closed on
May 28, 2004
Sold by
Zayas Albert
Bought by
Mercedes Homes Inc
Purchase Details
Closed on
Apr 6, 2004
Sold by
Odonnell Garrett P and Odonnell James J
Bought by
Zayas Albert
Purchase Details
Closed on
Mar 24, 2004
Sold by
Odonnell Garrett P and Estate Of Beatrice A Odonnell
Bought by
Odonnell Garrett P and Odonnell James J
Purchase Details
Closed on
Dec 13, 1993
Sold by
Nationsbank Fl N A
Bought by
Odonnell James J and Odonnell A S
Create a Home Valuation Report for This Property
The Home Valuation Report is an in-depth analysis detailing your home's value as well as a comparison with similar homes in the area
Home Values in the Area
Average Home Value in this Area
Purchase History
| Date | Buyer | Sale Price | Title Company |
|---|---|---|---|
| Lombardo John | -- | Attorney | |
| Lombardo Teresa | -- | Attorney | |
| Corcoran Lori J | -- | Attorney | |
| Lombardo Teri | $146,300 | B D R Title | |
| Mercedes Homes Inc | $28,000 | B D R Title Corporation | |
| Zayas Albert | $17,000 | Equitable Title Agency Inc | |
| Odonnell Garrett P | -- | Equitable Title Agency | |
| Odonnell James J | $10,800 | -- |
Source: Public Records
Tax History Compared to Growth
Tax History
| Year | Tax Paid | Tax Assessment Tax Assessment Total Assessment is a certain percentage of the fair market value that is determined by local assessors to be the total taxable value of land and additions on the property. | Land | Improvement |
|---|---|---|---|---|
| 2025 | $3,563 | $243,370 | -- | -- |
| 2024 | $3,446 | $245,520 | -- | -- |
| 2023 | $3,446 | $239,190 | $0 | $0 |
| 2022 | $3,108 | $224,260 | $0 | $0 |
| 2021 | $2,866 | $174,930 | $42,000 | $132,930 |
| 2020 | $2,660 | $159,210 | $40,000 | $119,210 |
| 2019 | $2,545 | $152,400 | $35,000 | $117,400 |
| 2018 | $2,426 | $141,560 | $27,000 | $114,560 |
| 2017 | $2,327 | $130,160 | $24,000 | $106,160 |
| 2016 | $2,183 | $112,060 | $18,000 | $94,060 |
| 2015 | $2,075 | $101,230 | $15,000 | $86,230 |
| 2014 | $1,823 | $84,690 | $11,000 | $73,690 |
Source: Public Records
Map
Nearby Homes
- 3970 Curtis Blvd
- 7070 Bismarck Rd
- 4200 Lee Hall Place
- 000 Arabella Ln
- 7081 Bayfront Rd
- 0 Kanawha St
- 7155 Ackerman Ave
- 961 Kaufman St
- 520 Arabella Ln
- 846 W Virginia St
- 7020 Ackerman Ave
- 973 Poinsetta St
- 7065 Bright Ave
- 208 Capron Rd
- 977 Poinsetta St
- 973 Kaufman St
- 6839 Ackerman Ave
- 4390 Everglades St
- 995 Barclay Dr
- 1010 Illinois Rd