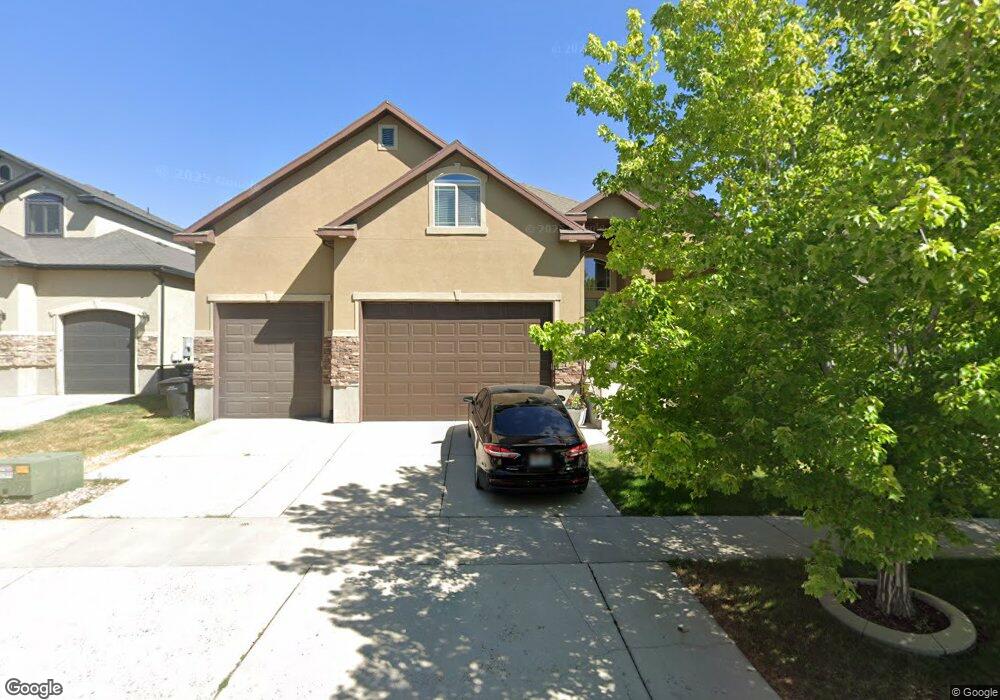
7066 Knowley Rd West Jordan, UT 84081
Jordan Hills NeighborhoodEstimated Value: $591,000 - $696,000
4
Beds
3
Baths
3,989
Sq Ft
$162/Sq Ft
Est. Value
About This Home
This home is located at 7066 Knowley Rd, West Jordan, UT 84081 and is currently estimated at $644,507, approximately $161 per square foot. 7066 Knowley Rd is a home located in Salt Lake County with nearby schools including Sunset Ridge Middle School, Copper Hills High School, and Ascent Academies of Utah West Jordan.
Ownership History
Date
Name
Owned For
Owner Type
Purchase Details
Closed on
Aug 11, 2020
Sold by
Black Richard Scott
Bought by
Black Richard and Black Leslie
Current Estimated Value
Home Financials for this Owner
Home Financials are based on the most recent Mortgage that was taken out on this home.
Original Mortgage
$150,000
Outstanding Balance
$106,509
Interest Rate
3%
Mortgage Type
New Conventional
Estimated Equity
$537,998
Purchase Details
Closed on
Nov 17, 2009
Sold by
Deseret Development Holding Company Llc
Bought by
Black Richard Scott
Home Financials for this Owner
Home Financials are based on the most recent Mortgage that was taken out on this home.
Original Mortgage
$180,250
Interest Rate
4.83%
Mortgage Type
New Conventional
Purchase Details
Closed on
Jul 28, 2005
Sold by
Dakota Homes Inc
Bought by
Deseret Development Holding Co Llc
Create a Home Valuation Report for This Property
The Home Valuation Report is an in-depth analysis detailing your home's value as well as a comparison with similar homes in the area
Home Values in the Area
Average Home Value in this Area
Purchase History
| Date | Buyer | Sale Price | Title Company |
|---|---|---|---|
| Black Richard | -- | Vanguard Title Orem | |
| Black Richard Scott | -- | Utah Mountain Title | |
| Deseret Development Holding Co Llc | -- | Meridian Title |
Source: Public Records
Mortgage History
| Date | Status | Borrower | Loan Amount |
|---|---|---|---|
| Open | Black Richard | $150,000 | |
| Closed | Black Richard Scott | $180,250 |
Source: Public Records
Tax History Compared to Growth
Tax History
| Year | Tax Paid | Tax Assessment Tax Assessment Total Assessment is a certain percentage of the fair market value that is determined by local assessors to be the total taxable value of land and additions on the property. | Land | Improvement |
|---|---|---|---|---|
| 2025 | $3,165 | $629,300 | $100,600 | $528,700 |
| 2024 | $3,165 | $608,900 | $97,300 | $511,600 |
| 2023 | $3,356 | $608,500 | $95,300 | $513,200 |
| 2022 | $3,436 | $612,900 | $93,500 | $519,400 |
| 2021 | $2,766 | $449,200 | $74,100 | $375,100 |
| 2020 | $2,658 | $405,100 | $74,100 | $331,000 |
| 2019 | $2,622 | $391,800 | $74,100 | $317,700 |
| 2018 | $2,425 | $359,400 | $72,000 | $287,400 |
| 2017 | $2,265 | $334,300 | $72,000 | $262,300 |
| 2016 | $2,142 | $297,000 | $72,000 | $225,000 |
| 2015 | $1,962 | $265,300 | $73,300 | $192,000 |
| 2014 | $1,865 | $248,300 | $69,900 | $178,400 |
Source: Public Records
Map
Nearby Homes
- 7953 S 7110 W
- 7011 W Saw Timber Way
- 7069 W Cottage Point Dr
- 7009 W 7895 S
- 7169 Moorepark Place
- 7182 Moorepark Place Unit 10
- Witzel Plan at The Sycamores
- Beatrix Plan at The Sycamores
- Sweetwater Plan at The Sycamores
- Princeton Plan at The Sycamores
- Dakota Plan at The Sycamores
- Dashell Plan at The Sycamores
- Roosevelt Plan at The Sycamores
- Wasatch Plan at The Sycamores
- 7176 Moorepark Place
- 7919 S Ares Ct
- 7171 W 8170 S
- 7092 W Jayson Bend Dr
- 8169 S Flaxton Ln
- 7776 S Iron Core Ln
- 7056 Knowley Rd
- 7076 Knowley Rd
- 7071 Dry Sycamore Ln
- 7071 W Dry Sycamore Ln
- 7077 Dry Sycamore Ln
- 7077 W Dry Sycamore Ln
- 7063 Dry Sycamore Ln
- 7046 Knowley Rd
- 7082 W Knowley Rd
- 7082 W Knowley Rd
- 7067 W Knowley Rd
- 7067 W Knowley Rd
- 7087 Dry Sycamore Ln
- 7057 W Knowley Rd Unit S-438
- 7057 W Knowley Rd
- 7063 Knowley Rd Unit S-439
- 7063 Knowley Rd
- 7057 W Knowley Rd
- 7087 W Dry Sycamore Ln
- 7057 Dry Sycamore Ln