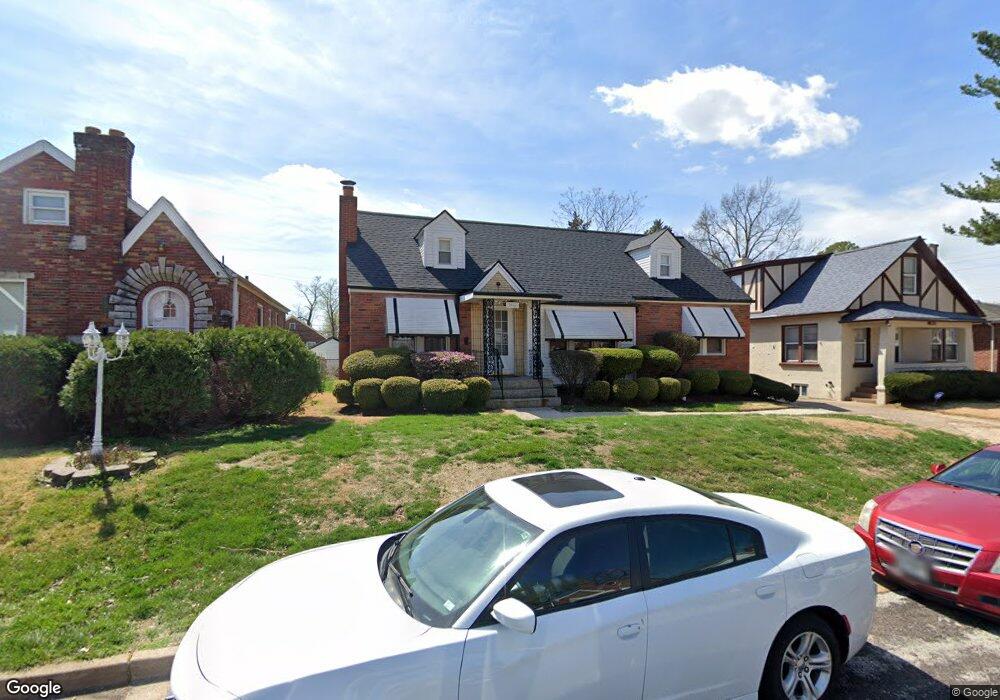
7066 Plymouth Ave Saint Louis, MO 63130
Estimated Value: $202,000 - $227,000
4
Beds
2
Baths
1,650
Sq Ft
$128/Sq Ft
Est. Value
About This Home
This home is located at 7066 Plymouth Ave, Saint Louis, MO 63130 and is currently estimated at $212,019, approximately $128 per square foot. 7066 Plymouth Ave is a home located in St. Louis County with nearby schools including Pershing Elementary School, Brittany Woods Middle School, and University City High School.
Ownership History
Date
Name
Owned For
Owner Type
Purchase Details
Closed on
Oct 16, 1998
Sold by
Woods Tracy A and Hayes Tracy A
Bought by
Woods Michael D and Woods Tracy A
Current Estimated Value
Home Financials for this Owner
Home Financials are based on the most recent Mortgage that was taken out on this home.
Original Mortgage
$14,300
Interest Rate
6.85%
Mortgage Type
Stand Alone Second
Purchase Details
Closed on
Aug 22, 1997
Sold by
Household Realty Corp
Bought by
Hayes Tracy A and Woods Michael D
Home Financials for this Owner
Home Financials are based on the most recent Mortgage that was taken out on this home.
Original Mortgage
$55,710
Outstanding Balance
$10,158
Interest Rate
10.5%
Estimated Equity
$201,861
Purchase Details
Closed on
Nov 25, 1996
Sold by
Alexander Lillie F
Bought by
Brockmeyer Ronald J and Household Realty Corp
Create a Home Valuation Report for This Property
The Home Valuation Report is an in-depth analysis detailing your home's value as well as a comparison with similar homes in the area
Home Values in the Area
Average Home Value in this Area
Purchase History
| Date | Buyer | Sale Price | Title Company |
|---|---|---|---|
| Woods Michael D | -- | -- | |
| Hayes Tracy A | -- | First American Title Ins Co | |
| Brockmeyer Ronald J | $42,819 | -- |
Source: Public Records
Mortgage History
| Date | Status | Borrower | Loan Amount |
|---|---|---|---|
| Closed | Woods Michael D | $14,300 | |
| Open | Hayes Tracy A | $55,710 |
Source: Public Records
Tax History Compared to Growth
Tax History
| Year | Tax Paid | Tax Assessment Tax Assessment Total Assessment is a certain percentage of the fair market value that is determined by local assessors to be the total taxable value of land and additions on the property. | Land | Improvement |
|---|---|---|---|---|
| 2025 | $2,218 | $37,310 | $6,970 | $30,340 |
| 2024 | $2,218 | $30,780 | $2,390 | $28,390 |
| 2023 | $2,218 | $30,780 | $2,390 | $28,390 |
| 2022 | $1,761 | $22,660 | $2,390 | $20,270 |
| 2021 | $1,743 | $22,660 | $2,390 | $20,270 |
| 2020 | $1,866 | $23,690 | $5,830 | $17,860 |
| 2019 | $1,849 | $23,690 | $5,830 | $17,860 |
| 2018 | $1,613 | $19,040 | $3,550 | $15,490 |
| 2017 | $1,616 | $19,040 | $3,550 | $15,490 |
| 2016 | $1,575 | $17,740 | $3,930 | $13,810 |
| 2015 | $1,581 | $17,740 | $3,930 | $13,810 |
| 2014 | $1,515 | $16,680 | $2,680 | $14,000 |
Source: Public Records
Map
Nearby Homes
- 7055 Plymouth Ave
- 7039 Plymouth Ave
- 7012 Melrose Ave
- 7048 Raymond Ave
- 6954 Plymouth Ave
- 1085 Pennsylvania Ave
- 1118 George St
- 6934 Julian Ave
- 6937 Etzel Ave
- 6922 Plymouth Ave
- 7315 Ahern Ave
- 6835 Etzel Ave
- 1251 Waldron Ave
- 1209 Griefield Place
- 7032 Canton Ave
- 7343 Drexel Dr
- 1207 Buckner Place
- 6817 Crest Ave
- 7171 White Oak Ln
- 6821 Raymond Ave
- 7072 Plymouth Ave
- 7062 Plymouth Ave
- 7074 Plymouth Ave
- 7058 Plymouth Ave
- 7069 Corbitt Ave
- 7065 Corbitt Ave
- 7071 Corbitt Ave
- 7054 Plymouth Ave
- 7075 Corbitt Ave
- 7061 Corbitt Ave
- 7069 Plymouth Ave
- 7073 Plymouth Ave
- 7065 Plymouth Ave
- 7059 Corbitt Ave
- 7077 Plymouth Ave
- 7050 Plymouth Ave
- 7061 Plymouth Ave
- 1153 Partridge Ave
- 1149 Partridge Ave
- 7055 Corbitt Ave