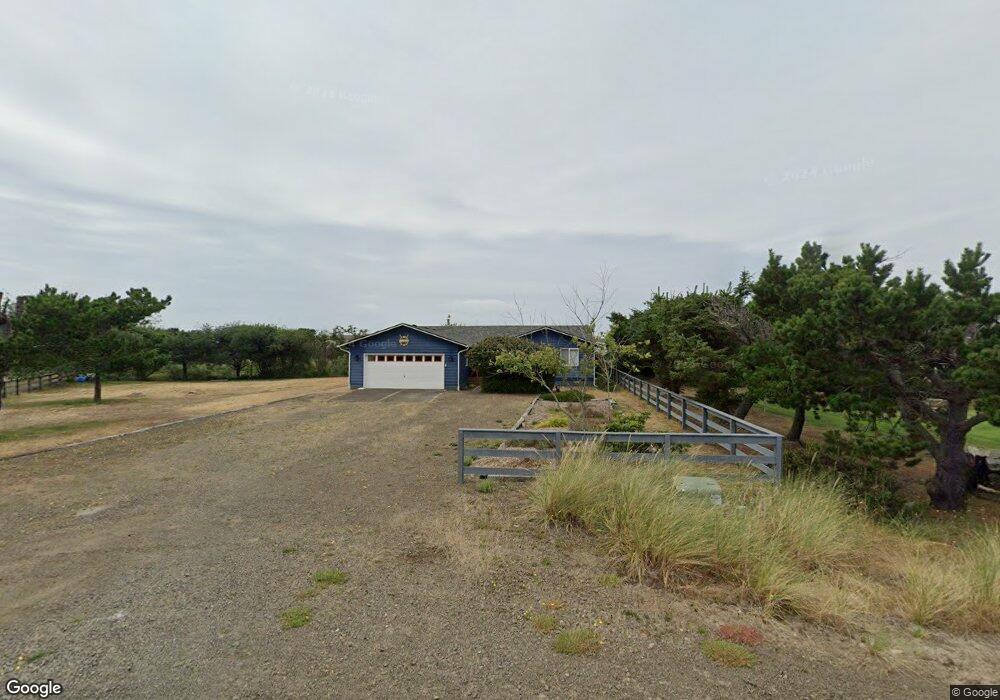
707 335th Place Ocean Park, WA 98640
Estimated Value: $396,000 - $522,000
3
Beds
2
Baths
1,589
Sq Ft
$297/Sq Ft
Est. Value
About This Home
This home is located at 707 335th Place, Ocean Park, WA 98640 and is currently estimated at $472,312, approximately $297 per square foot. 707 335th Place is a home located in Pacific County with nearby schools including Ilwaco Senior High School.
Ownership History
Date
Name
Owned For
Owner Type
Purchase Details
Closed on
Nov 7, 2020
Sold by
Wilton Ronald B and Wilton Vicki D
Bought by
Brass Reginald D and Brass Linda M
Current Estimated Value
Purchase Details
Closed on
Feb 17, 2015
Sold by
Wirth James M and Smith Linda J
Bought by
Wilton Ronald D and Wilton Vicki D
Home Financials for this Owner
Home Financials are based on the most recent Mortgage that was taken out on this home.
Original Mortgage
$182,000
Interest Rate
3.66%
Create a Home Valuation Report for This Property
The Home Valuation Report is an in-depth analysis detailing your home's value as well as a comparison with similar homes in the area
Home Values in the Area
Average Home Value in this Area
Purchase History
| Date | Buyer | Sale Price | Title Company |
|---|---|---|---|
| Brass Reginald D | $320,000 | Emerald Coast Title | |
| Wilton Ronald D | $181,673 | Pacific County Title Co |
Source: Public Records
Mortgage History
| Date | Status | Borrower | Loan Amount |
|---|---|---|---|
| Previous Owner | Wilton Ronald D | $182,000 |
Source: Public Records
Tax History Compared to Growth
Tax History
| Year | Tax Paid | Tax Assessment Tax Assessment Total Assessment is a certain percentage of the fair market value that is determined by local assessors to be the total taxable value of land and additions on the property. | Land | Improvement |
|---|---|---|---|---|
| 2025 | $3,180 | $445,000 | $142,000 | $303,000 |
| 2024 | $3,180 | $445,000 | $142,000 | $303,000 |
| 2023 | $3,077 | $393,000 | $83,300 | $309,700 |
| 2022 | $3,111 | $288,400 | $54,000 | $234,400 |
| 2021 | $3,123 | $266,000 | $45,000 | $221,000 |
| 2020 | $3,136 | $245,900 | $45,000 | $200,900 |
| 2019 | $2,833 | $220,800 | $45,000 | $175,800 |
| 2018 | $3,006 | $173,800 | $60,000 | $113,800 |
| 2017 | $2,430 | $173,800 | $60,000 | $113,800 |
| 2015 | $2,158 | $173,800 | $60,000 | $113,800 |
| 2014 | -- | $153,100 | $45,000 | $108,100 |
| 2012 | -- | $165,000 | $45,000 | $120,000 |
Source: Public Records
Map
Nearby Homes