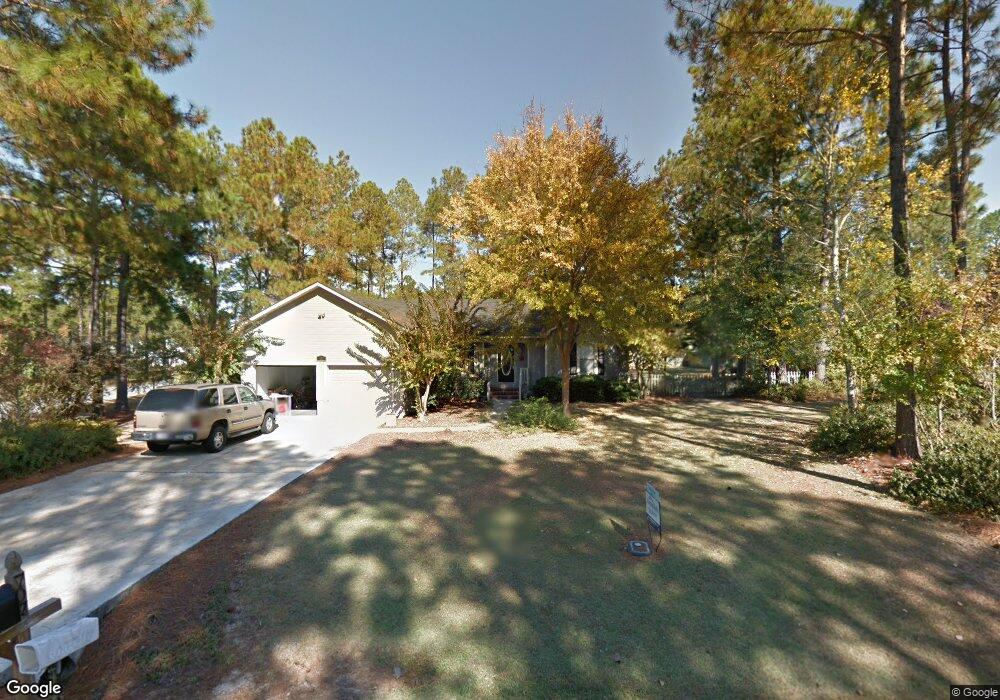
707 42nd St E Tifton, GA 31794
Estimated Value: $256,000 - $289,000
3
Beds
2
Baths
1,999
Sq Ft
$135/Sq Ft
Est. Value
About This Home
This home is located at 707 42nd St E, Tifton, GA 31794 and is currently estimated at $270,198, approximately $135 per square foot. 707 42nd St E is a home located in Tift County with nearby schools including Northside Primary School, Charles Spencer Elementary School, and J.T. Reddick School.
Ownership History
Date
Name
Owned For
Owner Type
Purchase Details
Closed on
May 3, 2013
Sold by
Rucker Keith S
Bought by
Spicer Ronald and Spicer Christine
Current Estimated Value
Purchase Details
Closed on
Dec 8, 1995
Sold by
Gardner Robert A
Bought by
Rucker Keith S
Purchase Details
Closed on
Mar 14, 1994
Sold by
Gardner Sonia M
Bought by
Gardner Robert A
Purchase Details
Closed on
Jul 6, 1993
Sold by
Sunbelt Plantations Inc
Bought by
Gardner Robert A and Gardner Sonia M
Create a Home Valuation Report for This Property
The Home Valuation Report is an in-depth analysis detailing your home's value as well as a comparison with similar homes in the area
Home Values in the Area
Average Home Value in this Area
Purchase History
| Date | Buyer | Sale Price | Title Company |
|---|---|---|---|
| Spicer Ronald | $129,000 | -- | |
| Rucker Keith S | $70,000 | -- | |
| Gardner Robert A | -- | -- | |
| Gardner Robert A | $10,000 | -- |
Source: Public Records
Tax History Compared to Growth
Tax History
| Year | Tax Paid | Tax Assessment Tax Assessment Total Assessment is a certain percentage of the fair market value that is determined by local assessors to be the total taxable value of land and additions on the property. | Land | Improvement |
|---|---|---|---|---|
| 2024 | $2,132 | $92,994 | $10,000 | $82,994 |
| 2023 | $2,274 | $63,184 | $8,000 | $55,184 |
| 2022 | $1,841 | $63,184 | $8,000 | $55,184 |
| 2021 | $1,852 | $63,184 | $8,000 | $55,184 |
| 2020 | $1,502 | $53,066 | $8,000 | $45,066 |
| 2019 | $1,502 | $53,066 | $8,000 | $45,066 |
| 2018 | $1,503 | $53,066 | $8,000 | $45,066 |
| 2017 | $1,526 | $52,570 | $8,000 | $44,570 |
| 2016 | $1,528 | $52,570 | $8,000 | $44,570 |
| 2015 | $1,528 | $52,570 | $8,000 | $44,570 |
| 2014 | $1,489 | $52,570 | $8,000 | $44,570 |
| 2013 | -- | $52,569 | $8,000 | $44,569 |
Source: Public Records
Map
Nearby Homes
- 714 44th St E
- 4204 Lakeview Dr
- 717 E 44th St
- 0 44th St E
- 0 E 46th St
- 913 E 46th St
- 903 42nd St E
- 346 Somers Ln
- 2612 Goff St
- 2417 Belmont Ave
- 2411 Davis Ave
- 153 Belflower Rd
- 0 Belflower Rd Unit 25624433
- 0 Belflower Rd Unit 139026
- 0 Belflower Rd Unit 24022932
- 0 Belflower Rd Unit 138547
- 0 Belflower Rd Unit 10554704
- 2020 Davis Ave
- 2021 Davis Ave
- 2214 Love Ave