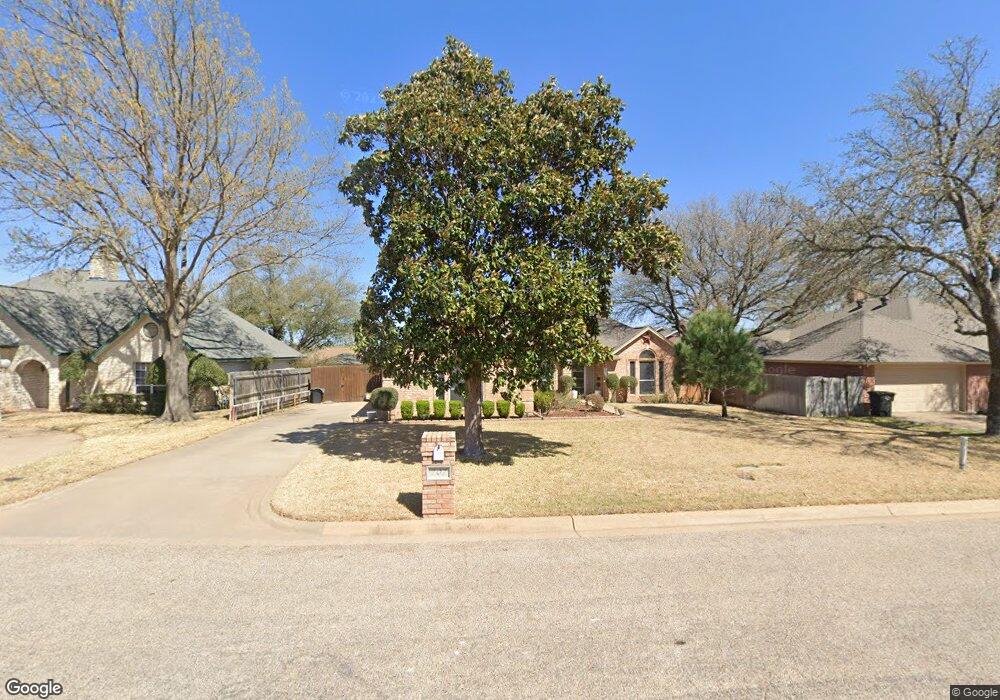
707 Berkley Dr Cleburne, TX 76033
Estimated Value: $303,000 - $324,000
3
Beds
2
Baths
1,917
Sq Ft
$164/Sq Ft
Est. Value
About This Home
This home is located at 707 Berkley Dr, Cleburne, TX 76033 and is currently estimated at $313,667, approximately $163 per square foot. 707 Berkley Dr is a home located in Johnson County with nearby schools including Coleman Elementary School, Lowell Smith Jr. Middle School, and Cleburne High School.
Ownership History
Date
Name
Owned For
Owner Type
Purchase Details
Closed on
Feb 23, 2022
Sold by
Gilliam Gwendolyn S
Bought by
Gilliam Gwendolyn S
Current Estimated Value
Home Financials for this Owner
Home Financials are based on the most recent Mortgage that was taken out on this home.
Original Mortgage
$138,842
Outstanding Balance
$110,988
Interest Rate
2.93%
Mortgage Type
Credit Line Revolving
Estimated Equity
$202,679
Purchase Details
Closed on
Apr 15, 2013
Sold by
Barkley Rentals Inc
Bought by
Cash Gwendolyn
Home Financials for this Owner
Home Financials are based on the most recent Mortgage that was taken out on this home.
Original Mortgage
$126,172
Interest Rate
3.75%
Mortgage Type
FHA
Purchase Details
Closed on
Nov 8, 2011
Sold by
Nunn Craig R and Nunn Brandi D
Bought by
Barkley Rentals Inc
Purchase Details
Closed on
Feb 27, 2008
Sold by
Wade Chad Anthony and Wade Gina
Bought by
Nunn Craig R and Nunn Brandi D
Home Financials for this Owner
Home Financials are based on the most recent Mortgage that was taken out on this home.
Original Mortgage
$141,878
Interest Rate
5.47%
Mortgage Type
FHA
Create a Home Valuation Report for This Property
The Home Valuation Report is an in-depth analysis detailing your home's value as well as a comparison with similar homes in the area
Home Values in the Area
Average Home Value in this Area
Purchase History
| Date | Buyer | Sale Price | Title Company |
|---|---|---|---|
| Gilliam Gwendolyn S | -- | New Title Company Name | |
| Cash Gwendolyn | -- | None Available | |
| Barkley Rentals Inc | $104,050 | None Available | |
| Nunn Craig R | -- | Fatco |
Source: Public Records
Mortgage History
| Date | Status | Borrower | Loan Amount |
|---|---|---|---|
| Open | Gilliam Gwendolyn S | $138,842 | |
| Previous Owner | Cash Gwendolyn | $126,172 | |
| Previous Owner | Nunn Craig R | $141,878 |
Source: Public Records
Tax History Compared to Growth
Tax History
| Year | Tax Paid | Tax Assessment Tax Assessment Total Assessment is a certain percentage of the fair market value that is determined by local assessors to be the total taxable value of land and additions on the property. | Land | Improvement |
|---|---|---|---|---|
| 2025 | $2,567 | $289,772 | $57,500 | $232,272 |
| 2024 | $3,919 | $175,773 | $0 | $0 |
| 2023 | $2,228 | $159,794 | $25,000 | $134,794 |
| 2022 | $3,999 | $159,794 | $25,000 | $134,794 |
| 2021 | $4,169 | $159,794 | $25,000 | $134,794 |
| 2020 | $4,380 | $158,059 | $25,000 | $133,059 |
| 2019 | $4,435 | $158,059 | $25,000 | $133,059 |
| 2018 | $4,034 | $158,059 | $25,000 | $133,059 |
| 2017 | $3,652 | $158,059 | $25,000 | $133,059 |
| 2016 | $3,320 | $112,779 | $15,000 | $97,779 |
| 2015 | $2,499 | $112,779 | $15,000 | $97,779 |
| 2014 | $2,499 | $105,580 | $15,000 | $90,580 |
Source: Public Records
Map
Nearby Homes
- 1103 Trace Rd
- 1116 Willowcreek Rd
- 1204 W Westhill Dr
- 4112 Highland Dr
- 4101 Highland Dr
- 1115 Green River Trail
- 909 Highland Dr
- 311 Sunset Dr
- 215 Sunset Dr
- 1225 Crestwood Dr
- 1211 Greenbriar Ln
- 840 S Ridgeway Dr
- 101 S Pendell Ave
- 911 W Chambers St
- 616 Bellevue Dr
- 714 Forrest Ave
- 404 Forrest Ave
- 800 Misty Ln
- 1208 Cindy Ln
- 1104 Cherrywood Dr
- 705 Berkley Dr
- 709 Berkley Dr
- 1016 W Westhill Dr
- 934 Featherston St
- 703 Berkley Dr
- 1021 W Westhill Dr
- 1003 Crestwood Dr
- 1005 Crestwood Dr
- 1001 Crestwood Dr
- 1001 Crestwood Dr
- 1015 W Westhill Dr
- 1101 W Westhill Dr
- 803 Berkley Dr
- 1007 W Westhill Dr
- 1002 Crestwood Dr
- 802 Berkley Dr
- 1103 W Westhill Dr
- 1000 Crestwood Dr
- 1004 Crestwood Dr
- 805 Berkley Dr