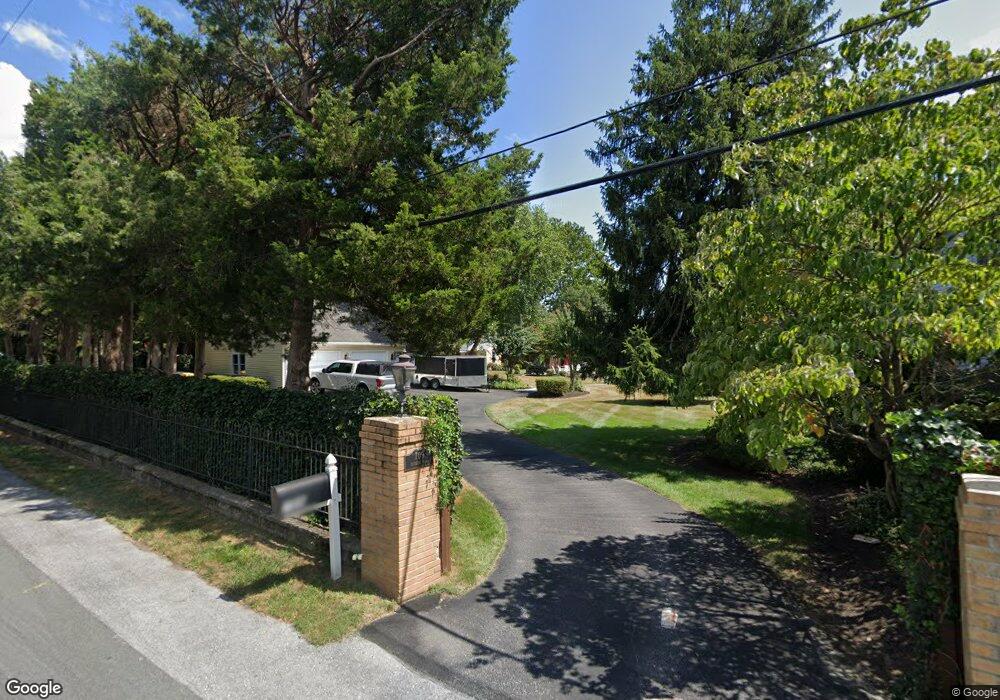
707 Dividing Rd Severna Park, MD 21146
Estimated Value: $1,521,000 - $2,113,000
3
Beds
2
Baths
3,501
Sq Ft
$514/Sq Ft
Est. Value
About This Home
This home is located at 707 Dividing Rd, Severna Park, MD 21146 and is currently estimated at $1,800,631, approximately $514 per square foot. 707 Dividing Rd is a home located in Anne Arundel County with nearby schools including Jones Elementary School, Severna Park Middle School, and Severna Park High School.
Ownership History
Date
Name
Owned For
Owner Type
Purchase Details
Closed on
Sep 5, 2025
Sold by
Valle Brian D and Valle Ellen
Bought by
Zhu Jiakai and Zhu Ashley E
Current Estimated Value
Home Financials for this Owner
Home Financials are based on the most recent Mortgage that was taken out on this home.
Original Mortgage
$1,387,500
Outstanding Balance
$1,387,500
Interest Rate
5.63%
Mortgage Type
New Conventional
Estimated Equity
$413,131
Purchase Details
Closed on
Oct 28, 2009
Sold by
Mason Roy L
Bought by
Valle Brian D and Valle Ellen
Home Financials for this Owner
Home Financials are based on the most recent Mortgage that was taken out on this home.
Original Mortgage
$550,000
Interest Rate
5.36%
Mortgage Type
New Conventional
Purchase Details
Closed on
Oct 30, 2002
Sold by
Smith Chas P
Bought by
Mason Roy L and Mason Paula J
Create a Home Valuation Report for This Property
The Home Valuation Report is an in-depth analysis detailing your home's value as well as a comparison with similar homes in the area
Home Values in the Area
Average Home Value in this Area
Purchase History
| Date | Buyer | Sale Price | Title Company |
|---|---|---|---|
| Zhu Jiakai | $2,600,000 | Eagle Title | |
| Zhu Jiakai | $2,600,000 | Eagle Title | |
| Valle Brian D | $900,000 | -- | |
| Mason Roy L | $700,000 | -- |
Source: Public Records
Mortgage History
| Date | Status | Borrower | Loan Amount |
|---|---|---|---|
| Open | Zhu Jiakai | $1,387,500 | |
| Closed | Zhu Jiakai | $1,387,500 | |
| Previous Owner | Valle Brian D | $550,000 |
Source: Public Records
Tax History Compared to Growth
Tax History
| Year | Tax Paid | Tax Assessment Tax Assessment Total Assessment is a certain percentage of the fair market value that is determined by local assessors to be the total taxable value of land and additions on the property. | Land | Improvement |
|---|---|---|---|---|
| 2025 | $11,006 | $1,362,700 | -- | -- |
| 2024 | $11,006 | $1,193,100 | $768,100 | $425,000 |
| 2023 | $10,679 | $1,131,000 | $0 | $0 |
| 2022 | $9,979 | $1,068,900 | $0 | $0 |
| 2021 | $9,535 | $1,006,800 | $621,100 | $385,700 |
| 2020 | $9,535 | $988,267 | $0 | $0 |
| 2019 | $9,342 | $969,733 | $0 | $0 |
| 2018 | $8,896 | $951,200 | $573,100 | $378,100 |
| 2017 | $8,723 | $890,000 | $0 | $0 |
| 2016 | -- | $828,800 | $0 | $0 |
| 2015 | -- | $767,600 | $0 | $0 |
| 2014 | -- | $767,600 | $0 | $0 |
Source: Public Records
Map
Nearby Homes
- 369 Magothy Rd Unit 12A
- 0 Magothy Rd Unit 9G MDAA2101266
- 360 Magothy Rd Unit 5A
- 360 Magothy Rd Unit 4E
- 360 Magothy Rd Unit 2G
- 360 Magothy Rd Unit 1F
- 360 Magothy Rd Unit 8B
- 360 Magothy Rd Unit 3D
- 360 Magothy Rd Unit 13C
- 360 Magothy Rd Unit 5D
- 360 Magothy Rd Unit 5F
- 360 Magothy Rd Unit 6F
- 360 Magothy Rd Unit 9J
- 360 Magothy Rd Unit 8J
- 360 Magothy Rd Unit 26J
- 360 Magothy Rd Unit 27J
- 360 Magothy Rd Unit 6B
- 360 Magothy Rd Unit 2E
- 360 Magothy Rd Unit 7K
- 360 Magothy Rd Unit 8H
- 709 Dividing Rd
- 705 Dividing Rd
- 398 Magothy Rd
- 0 Magothy Rd Unit 4A
- 711 Dividing Rd
- 396B Magothy Rd
- 336 Community Rd
- 713 Dividing Rd
- 396A Magothy Rd
- 715 Dividing Rd
- 394B Magothy Rd
- 334 Community Rd
- 394 Magothy Rd
- 717 Dividing Rd
- 394A Magothy Rd
- 716 Dividing Rd
- 330 Community Rd
- 392 Magothy Rd
- 719 Dividing Rd
- 393 Magothy Rd