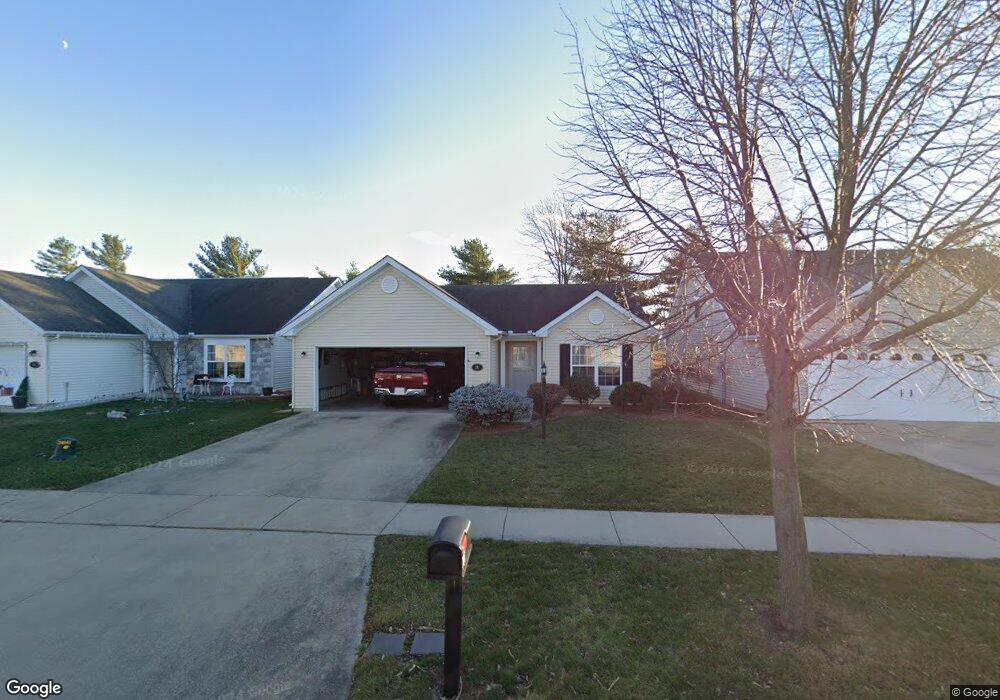
707 Doisy Ln Champaign, IL 61822
Estimated Value: $218,000 - $226,000
2
Beds
2
Baths
1,200
Sq Ft
$185/Sq Ft
Est. Value
About This Home
This home is located at 707 Doisy Ln, Champaign, IL 61822 and is currently estimated at $222,238, approximately $185 per square foot. 707 Doisy Ln is a home located in Champaign County with nearby schools including Central High School, Judah Christian School, and The High School of Saint Thomas More.
Ownership History
Date
Name
Owned For
Owner Type
Purchase Details
Closed on
Apr 5, 2017
Sold by
Braun Eric and Braun Amanda R
Bought by
Seaman Patricia
Current Estimated Value
Home Financials for this Owner
Home Financials are based on the most recent Mortgage that was taken out on this home.
Original Mortgage
$112,200
Outstanding Balance
$93,469
Interest Rate
4.25%
Mortgage Type
New Conventional
Estimated Equity
$128,769
Purchase Details
Closed on
Feb 13, 2017
Sold by
Cunnigham Kenneth
Bought by
Braun Eric and Braun Amanda R
Home Financials for this Owner
Home Financials are based on the most recent Mortgage that was taken out on this home.
Original Mortgage
$112,200
Outstanding Balance
$93,469
Interest Rate
4.25%
Mortgage Type
New Conventional
Estimated Equity
$128,769
Purchase Details
Closed on
Dec 19, 2005
Sold by
Atkins Clinton C
Bought by
Braun Eric
Create a Home Valuation Report for This Property
The Home Valuation Report is an in-depth analysis detailing your home's value as well as a comparison with similar homes in the area
Purchase History
| Date | Buyer | Sale Price | Title Company |
|---|---|---|---|
| Seaman Patricia | $132,000 | Attorney | |
| Braun Eric | -- | Attorney | |
| Braun Eric | $130,000 | -- |
Source: Public Records
Mortgage History
| Date | Status | Borrower | Loan Amount |
|---|---|---|---|
| Open | Seaman Patricia | $112,200 |
Source: Public Records
Tax History
| Year | Tax Paid | Tax Assessment Tax Assessment Total Assessment is a certain percentage of the fair market value that is determined by local assessors to be the total taxable value of land and additions on the property. | Land | Improvement |
|---|---|---|---|---|
| 2024 | $4,057 | $55,980 | $14,160 | $41,820 |
| 2023 | $4,057 | $50,990 | $12,900 | $38,090 |
| 2022 | $3,774 | $47,040 | $11,900 | $35,140 |
| 2021 | $3,673 | $46,120 | $11,670 | $34,450 |
| 2020 | $3,556 | $44,780 | $11,330 | $33,450 |
| 2019 | $3,430 | $43,860 | $11,100 | $32,760 |
| 2018 | $3,345 | $43,170 | $10,930 | $32,240 |
| 2017 | $3,278 | $42,280 | $10,700 | $31,580 |
| 2016 | $2,929 | $41,410 | $10,480 | $30,930 |
| 2015 | $2,942 | $40,670 | $10,290 | $30,380 |
| 2014 | $2,917 | $40,670 | $10,290 | $30,380 |
| 2013 | $2,890 | $40,670 | $10,290 | $30,380 |
Source: Public Records
Map
Nearby Homes
- 1504 Newton Dr
- 412 Doisy Ln
- 501 Luria Ln
- 2748 J T Coffman Dr
- 409 Luria Ln
- 3207 Stanley Ln
- 1703 Interstate Dr
- 1609 Rion Dr
- 1805 Jeanne St
- 1210 Julie Dr
- 1203 Julie Dr
- 1811 Melanie Ln
- 1507 N Mckinley Ave
- 1902 Garden Hills Dr
- 1502 Powers Ln
- 111 Petry Ct
- 1604 Kirk Ln
- 35 W Olympian Dr
- LOT 202 of Atkins We Bloomington Rd
- 1501 Holly Hill Dr
Your Personal Tour Guide
Ask me questions while you tour the home.