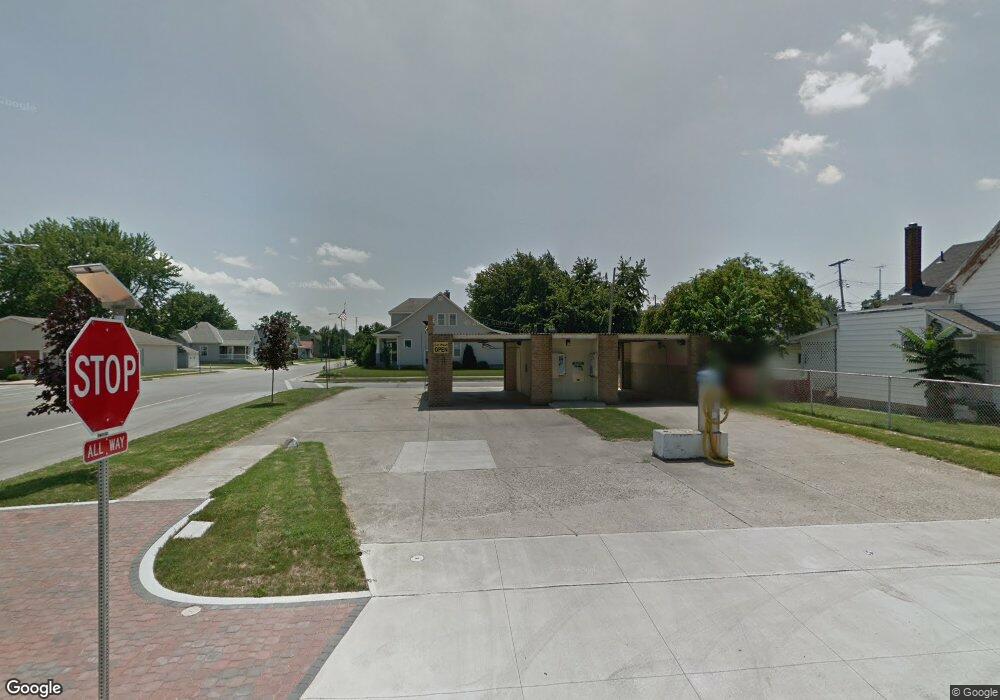
707 E Auglaize St Wapakoneta, OH 45895
Estimated Value: $103,784
Studio
3
Baths
1,148
Sq Ft
$90/Sq Ft
Est. Value
About This Home
This home is located at 707 E Auglaize St, Wapakoneta, OH 45895 and is currently estimated at $103,784, approximately $90 per square foot. 707 E Auglaize St is a home located in Auglaize County with nearby schools including Wapakoneta Elementary School, Wapakoneta High School, and Wapakoneta Middle School.
Ownership History
Date
Name
Owned For
Owner Type
Purchase Details
Closed on
Aug 25, 2017
Sold by
Meyer Robert A and Meyer Joshua R
Bought by
Bubbeys Bubbles Llc
Current Estimated Value
Purchase Details
Closed on
Dec 10, 2010
Sold by
Mcmahan Roger M and Mcmahan Vickie L
Bought by
Meyer Robert A and Meyer Joshua R
Home Financials for this Owner
Home Financials are based on the most recent Mortgage that was taken out on this home.
Original Mortgage
$36,000
Interest Rate
4.23%
Mortgage Type
Future Advance Clause Open End Mortgage
Create a Home Valuation Report for This Property
The Home Valuation Report is an in-depth analysis detailing your home's value as well as a comparison with similar homes in the area
Home Values in the Area
Average Home Value in this Area
Purchase History
| Date | Buyer | Sale Price | Title Company |
|---|---|---|---|
| Bubbeys Bubbles Llc | $25,000 | Attorney | |
| Meyer Robert A | $45,000 | Attorney |
Source: Public Records
Mortgage History
| Date | Status | Borrower | Loan Amount |
|---|---|---|---|
| Previous Owner | Meyer Robert A | $36,000 |
Source: Public Records
Tax History
| Year | Tax Paid | Tax Assessment Tax Assessment Total Assessment is a certain percentage of the fair market value that is determined by local assessors to be the total taxable value of land and additions on the property. | Land | Improvement |
|---|---|---|---|---|
| 2025 | $515 | $10,570 | $6,370 | $4,200 |
| 2024 | $515 | $10,570 | $6,370 | $4,200 |
| 2023 | $457 | $10,570 | $6,370 | $4,200 |
| 2022 | $495 | $10,420 | $6,370 | $4,050 |
| 2021 | $475 | $10,420 | $6,370 | $4,050 |
| 2020 | $477 | $10,423 | $6,370 | $4,053 |
| 2019 | $483 | $10,423 | $6,370 | $4,053 |
| 2018 | $484 | $10,423 | $6,370 | $4,053 |
| 2017 | $481 | $10,423 | $6,370 | $4,053 |
| 2016 | $472 | $10,053 | $6,066 | $3,987 |
| 2015 | $728 | $10,053 | $6,066 | $3,987 |
| 2014 | $739 | $10,053 | $6,066 | $3,987 |
| 2013 | $843 | $10,053 | $6,066 | $3,987 |
Source: Public Records
Map
Nearby Homes
- 8 S Seltzer St
- 1108 Middle St
- 201 E Pearl St
- 9 E Silver St
- 606 Highland Ave
- 105 E Pearl St
- 307 W Auglaize St
- 309 W Silver St
- 602 Murray St
- 306 W Plum St
- 506 W Pearl St
- 309 Cole Dr
- 309 Cole St
- 424 Hoopengarner St
- 1105 Holley St
- 1207 Navajo Trail
- 808 Aster Dr
- 818 Aster Dr
- 918 Carnation Dr
- 1100 W Auglaize St