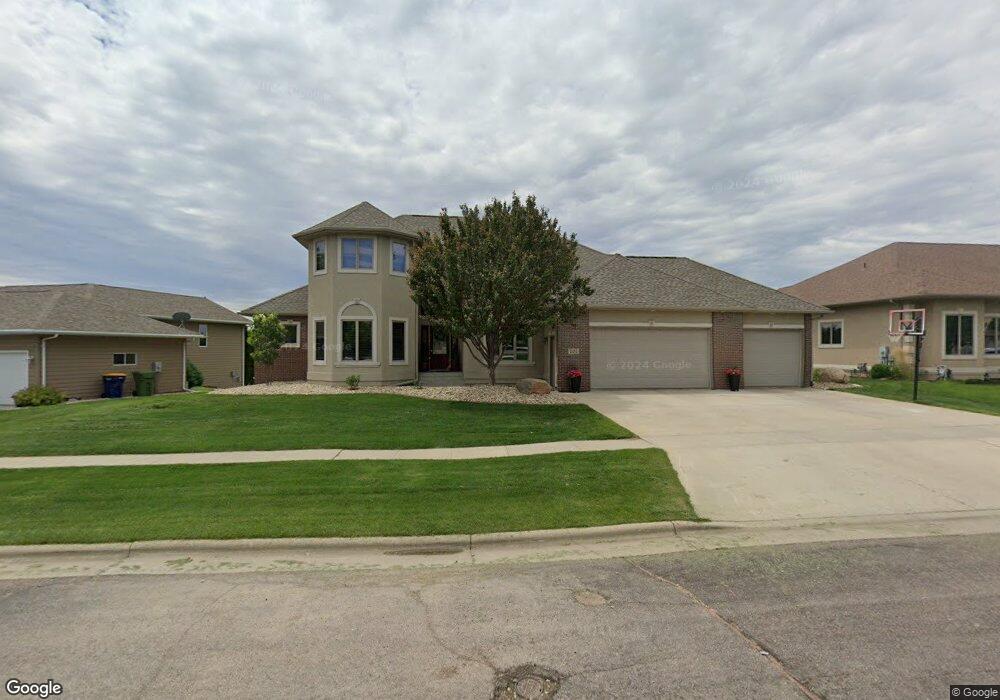
707 Eagle Run Unkn Dell Rapids, SD 57022
Estimated Value: $719,000 - $816,000
5
Beds
4
Baths
4,706
Sq Ft
$160/Sq Ft
Est. Value
About This Home
This home is located at 707 Eagle Run Unkn, Dell Rapids, SD 57022 and is currently estimated at $753,357, approximately $160 per square foot. 707 Eagle Run Unkn is a home located in Minnehaha County with nearby schools including Dell Rapids Elementary School, Dell Rapids Middle School, and Dell Rapids High School.
Ownership History
Date
Name
Owned For
Owner Type
Purchase Details
Closed on
Nov 22, 2024
Sold by
Te Velde Carson J and Te Velde Morgan
Bought by
Brown Derek T and Brown Haley
Current Estimated Value
Home Financials for this Owner
Home Financials are based on the most recent Mortgage that was taken out on this home.
Original Mortgage
$588,000
Outstanding Balance
$582,594
Interest Rate
6.54%
Estimated Equity
$170,763
Purchase Details
Closed on
Feb 8, 2019
Sold by
Olson Ryan and Olson Erin
Bought by
Velde Carson J Te and Velde Morgan Te
Home Financials for this Owner
Home Financials are based on the most recent Mortgage that was taken out on this home.
Original Mortgage
$200,000
Interest Rate
4.5%
Mortgage Type
New Conventional
Purchase Details
Closed on
Sep 17, 2012
Sold by
The Bank Of New Yorkk
Bought by
Olson Ryan and Olson Erin
Purchase Details
Closed on
Jul 13, 2012
Sold by
David E David E and Mers Inc
Bought by
Milstead Mike and The Bank Of New York Mellon
Create a Home Valuation Report for This Property
The Home Valuation Report is an in-depth analysis detailing your home's value as well as a comparison with similar homes in the area
Home Values in the Area
Average Home Value in this Area
Purchase History
| Date | Buyer | Sale Price | Title Company |
|---|---|---|---|
| Brown Derek T | $735,000 | -- | |
| Brown Derek T | $735,000 | -- | |
| Velde Carson J Te | $470,000 | Stewart Title Company | |
| Olson Ryan | $380,500 | -- | |
| Milstead Mike | -- | -- |
Source: Public Records
Mortgage History
| Date | Status | Borrower | Loan Amount |
|---|---|---|---|
| Open | Brown Derek T | $588,000 | |
| Closed | Brown Derek T | $588,000 | |
| Previous Owner | Velde Carson J Te | $200,000 |
Source: Public Records
Tax History
| Year | Tax Paid | Tax Assessment Tax Assessment Total Assessment is a certain percentage of the fair market value that is determined by local assessors to be the total taxable value of land and additions on the property. | Land | Improvement |
|---|---|---|---|---|
| 2024 | $9,533 | $705,200 | $75,300 | $629,900 |
| 2023 | $8,758 | $614,200 | $57,800 | $556,400 |
| 2022 | $9,198 | $609,800 | $45,900 | $563,900 |
| 2021 | $9,609 | $575,300 | $0 | $0 |
| 2020 | $9,609 | $597,600 | $0 | $0 |
| 2019 | $7,561 | $482,440 | $0 | $0 |
| 2018 | $7,955 | $480,160 | $0 | $0 |
| 2017 | $6,413 | $480,160 | $50,160 | $430,000 |
| 2016 | $6,413 | $380,500 | $51,030 | $329,470 |
| 2015 | $6,699 | $380,500 | $51,030 | $329,470 |
| 2014 | -- | $380,500 | $51,030 | $329,470 |
Source: Public Records
Map
Nearby Homes
- 0 Lt 1 Bk 8 Birdie Dr
- 0 Lt 2 Bk 8 Birdie Dr
- 0 Lt 3 Bk 8 Birdie Dr Dr
- 0 Lt 4 Bk 8 Birdie Dr Dr
- 0 Cir
- Bk10 Lot26 Tee Off Trail
- Bk17Lt3A3B Tee Off Trail
- Bk18 Lot3 Tee Off Trail
- Blk19 Lot1 Tee Off Trail
- Bk17Lt6A6B Tee Off Trail
- B17L1A1B1C Tee Off Trail
- Blk19 Lot2 Tee Off Trail
- Bk17L2A,2B Tee Off Trail
- Bk18 Lot2 Tee Off Trail
- Bk17Lt5A5B Tee Off Trail
- Bk17Lt4A4B Tee Off Trail
- Bk18 Lot 1 Tee Off Trail
- Bk10 Lot25 Tee Off Trail
- 809 W 3rd St
- Tee Off Tr Lot 24 Blk 10 N A
Your Personal Tour Guide
Ask me questions while you tour the home.