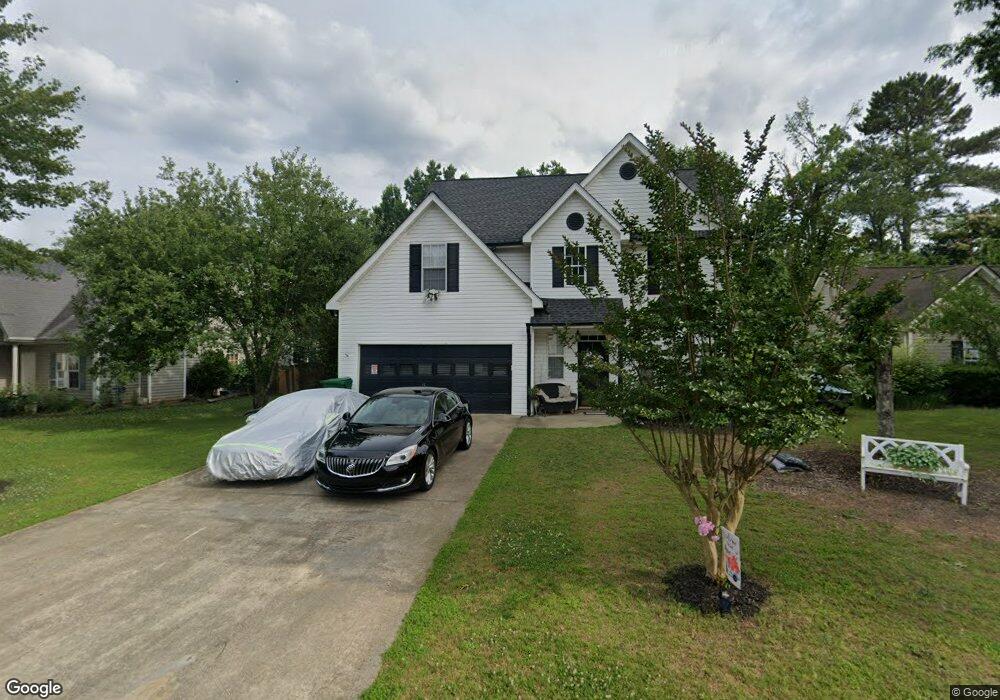
707 Jay St Canton, GA 30115
Estimated Value: $367,864 - $385,000
4
Beds
3
Baths
1,843
Sq Ft
$204/Sq Ft
Est. Value
About This Home
This home is located at 707 Jay St, Canton, GA 30115 and is currently estimated at $376,432, approximately $204 per square foot. 707 Jay St is a home located in Cherokee County with nearby schools including Holly Springs Elementary School, Rusk Middle School, and Sequoyah High School.
Ownership History
Date
Name
Owned For
Owner Type
Purchase Details
Closed on
Mar 26, 2001
Sold by
Sun Quality Homes Inc
Bought by
Howe Debra R
Current Estimated Value
Home Financials for this Owner
Home Financials are based on the most recent Mortgage that was taken out on this home.
Original Mortgage
$104,300
Outstanding Balance
$37,505
Interest Rate
7.02%
Mortgage Type
New Conventional
Estimated Equity
$338,927
Create a Home Valuation Report for This Property
The Home Valuation Report is an in-depth analysis detailing your home's value as well as a comparison with similar homes in the area
Home Values in the Area
Average Home Value in this Area
Purchase History
| Date | Buyer | Sale Price | Title Company |
|---|---|---|---|
| Howe Debra R | $130,400 | -- |
Source: Public Records
Mortgage History
| Date | Status | Borrower | Loan Amount |
|---|---|---|---|
| Open | Howe Debra R | $104,300 |
Source: Public Records
Tax History
| Year | Tax Paid | Tax Assessment Tax Assessment Total Assessment is a certain percentage of the fair market value that is determined by local assessors to be the total taxable value of land and additions on the property. | Land | Improvement |
|---|---|---|---|---|
| 2025 | $3,932 | $154,192 | $28,000 | $126,192 |
| 2024 | $796 | $155,840 | $28,000 | $127,840 |
| 2023 | $3,738 | $149,840 | $26,800 | $123,040 |
| 2022 | $3,273 | $125,720 | $22,000 | $103,720 |
| 2021 | $2,202 | $95,880 | $20,000 | $75,880 |
| 2020 | $2,521 | $80,880 | $14,800 | $66,080 |
| 2019 | $1,943 | $82,680 | $14,800 | $67,880 |
| 2018 | $2,392 | $73,560 | $13,200 | $60,360 |
| 2017 | $2,305 | $177,600 | $13,200 | $57,840 |
| 2016 | $1,616 | $163,500 | $12,000 | $53,400 |
| 2015 | $1,543 | $155,100 | $10,000 | $52,040 |
| 2014 | $1,419 | $142,800 | $10,000 | $47,120 |
Source: Public Records
Map
Nearby Homes
- 704 Jay St
- 132 Carl Barrett Dr
- 802 Hampton Way
- 332 Pine Acres Dr Unit 12
- 108 Riley Way
- 557 Hickory Rd
- 1100 Spring Place
- 153 Spring Creek Ct Unit 1
- 221 Mackenzie Ct
- 1980 Morgan Trace
- 108 Madison St
- 111 Sequoyah Cir
- 101 Alaina Rd
- 117 Alaina Rd
- 149 Alaina Rd
- 479 Bradshaw Ln
- 1032 Morgan Rd
- 1665 Doefield St
- 145 Alaina Rd
- 377 Westchester Way
Your Personal Tour Guide
Ask me questions while you tour the home.