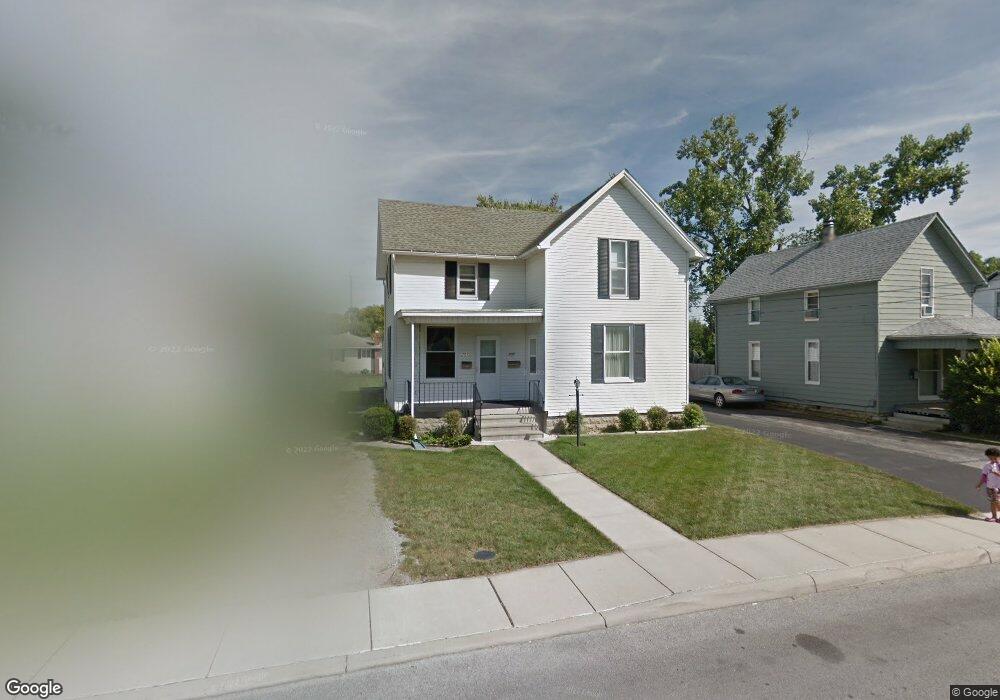
707 Morse St Findlay, OH 45840
Estimated Value: $123,000 - $179,000
4
Beds
3
Baths
1,888
Sq Ft
$78/Sq Ft
Est. Value
About This Home
This home is located at 707 Morse St, Findlay, OH 45840 and is currently estimated at $147,850, approximately $78 per square foot. 707 Morse St is a home located in Hancock County with nearby schools including Whittier Elementary School, Wilson Vance Elementary School, and Donnell Middle School.
Ownership History
Date
Name
Owned For
Owner Type
Purchase Details
Closed on
Dec 13, 2017
Sold by
Swinehart Cheryl A and Scoby Michael A
Bought by
Bakies Elijah and Bakies Kaitlyn M
Current Estimated Value
Home Financials for this Owner
Home Financials are based on the most recent Mortgage that was taken out on this home.
Original Mortgage
$66,500
Outstanding Balance
$56,002
Interest Rate
3.95%
Mortgage Type
New Conventional
Estimated Equity
$91,848
Purchase Details
Closed on
Jan 23, 2012
Sold by
Scoby Jack A and Scoby Kay C
Bought by
Scoby Jack A and Scoby Kay C
Create a Home Valuation Report for This Property
The Home Valuation Report is an in-depth analysis detailing your home's value as well as a comparison with similar homes in the area
Home Values in the Area
Average Home Value in this Area
Purchase History
| Date | Buyer | Sale Price | Title Company |
|---|---|---|---|
| Bakies Elijah | $70,000 | Flag City Title | |
| Scoby Jack A | -- | Attorney |
Source: Public Records
Mortgage History
| Date | Status | Borrower | Loan Amount |
|---|---|---|---|
| Open | Bakies Elijah | $66,500 |
Source: Public Records
Tax History
| Year | Tax Paid | Tax Assessment Tax Assessment Total Assessment is a certain percentage of the fair market value that is determined by local assessors to be the total taxable value of land and additions on the property. | Land | Improvement |
|---|---|---|---|---|
| 2024 | $1,271 | $34,880 | $5,080 | $29,800 |
| 2023 | $1,274 | $34,880 | $5,080 | $29,800 |
| 2022 | $1,269 | $34,880 | $5,080 | $29,800 |
| 2021 | $1,070 | $25,610 | $5,080 | $20,530 |
| 2020 | $1,070 | $25,610 | $5,080 | $20,530 |
| 2019 | $1,034 | $25,610 | $5,080 | $20,530 |
| 2018 | $917 | $20,800 | $4,620 | $16,180 |
| 2017 | $464 | $20,800 | $4,620 | $16,180 |
| 2016 | $542 | $20,800 | $4,620 | $16,180 |
| 2015 | $517 | $20,300 | $4,620 | $15,680 |
| 2014 | $517 | $20,300 | $4,620 | $15,680 |
| 2012 | $746 | $25,280 | $4,620 | $20,660 |
Source: Public Records
Map
Nearby Homes
- 15591 Canadian Way
- 15586 Canadian Way
- 15615 Canadian Way
- 1001 Decker Ave
- 829 Maple Ave
- 309 Huron Rd
- 655 Clinton Ct
- 1037 Fishlock Ave
- 216 1st St
- 1200 1st St
- 523 Center St
- 865 S Main St
- 640 Center St
- 1421 E Sandusky St
- 1100 Stall Dr
- 731 5th St
- 1421 Autumn Dr
- 206 Greenlawn Ave
- 0 Blanchard Ave
- 1020 Country Club Dr
Your Personal Tour Guide
Ask me questions while you tour the home.