Estimated Value: $89,880 - $152,000
3
Beds
1
Bath
1,204
Sq Ft
$104/Sq Ft
Est. Value
About This Home
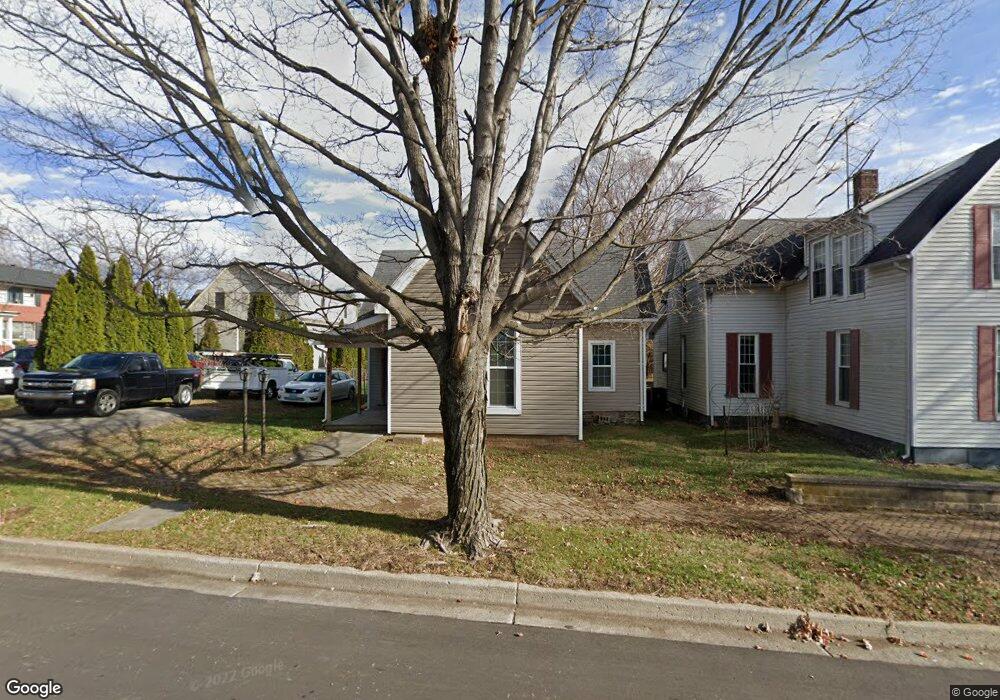
This home is located at 707 N Main St, Salem, IN 47167 and is currently estimated at $124,970, approximately $103 per square foot. 707 N Main St is a home located in Washington County with nearby schools including Bradie M. Shrum Lower Elementary School, Salem Middle School, and Salem High School.
Ownership History
Date
Name
Owned For
Owner Type
Purchase Details
Closed on
Feb 3, 2012
Sold by
J E Allen Builders Inc
Bought by
Morris Steven E
Current Estimated Value
Home Financials for this Owner
Home Financials are based on the most recent Mortgage that was taken out on this home.
Original Mortgage
$57,500
Outstanding Balance
$23,893
Interest Rate
4.2%
Mortgage Type
Adjustable Rate Mortgage/ARM
Estimated Equity
$101,077
Purchase Details
Closed on
Aug 6, 2008
Sold by
Fannie Mae
Bought by
Allen David P
Purchase Details
Closed on
Mar 18, 2008
Sold by
Burr Donald and Burr Mary J
Bought by
Fannie Mae
Create a Home Valuation Report for This Property
The Home Valuation Report is an in-depth analysis detailing your home's value as well as a comparison with similar homes in the area
Home Values in the Area
Average Home Value in this Area
Purchase History
| Date | Buyer | Sale Price | Title Company |
|---|---|---|---|
| Morris Steven E | -- | None Available | |
| Allen David P | -- | None Available | |
| Fannie Mae | $61,244 | None Available |
Source: Public Records
Mortgage History
| Date | Status | Borrower | Loan Amount |
|---|---|---|---|
| Open | Morris Steven E | $57,500 |
Source: Public Records
Tax History Compared to Growth
Tax History
| Year | Tax Paid | Tax Assessment Tax Assessment Total Assessment is a certain percentage of the fair market value that is determined by local assessors to be the total taxable value of land and additions on the property. | Land | Improvement |
|---|---|---|---|---|
| 2024 | $198 | $20,400 | $13,400 | $7,000 |
| 2023 | $203 | $19,700 | $13,400 | $6,300 |
| 2022 | $202 | $19,000 | $13,400 | $5,600 |
| 2021 | $197 | $18,500 | $13,400 | $5,100 |
| 2020 | $194 | $18,200 | $13,400 | $4,800 |
| 2019 | $264 | $20,400 | $13,400 | $7,000 |
| 2018 | $260 | $20,000 | $13,400 | $6,600 |
| 2017 | $234 | $20,300 | $13,400 | $6,900 |
| 2016 | $209 | $19,900 | $13,400 | $6,500 |
| 2014 | $197 | $19,200 | $12,500 | $6,700 |
| 2013 | $114 | $17,300 | $13,400 | $3,900 |
Source: Public Records
Map
Nearby Homes
- 801 N College Ave
- 800 Hayes Ave
- 808 Locust St
- 115 Nichols Ave
- 501 E Homer St
- 905 Locust St
- 404 E Mulberry St
- 406 W Mulberry St
- 301 E Market St
- 303 W Market St
- (Tract 2) 5484 State Road 135
- 52 Public Square
- 207 Southern Ave
- 0 W Mulberry St
- 205 S Harrison St
- 805 Smith St
- 540 Colony Dr
- 213 Washington Blvd
- 101, 103, & 105 Hounds Way
- 0 S Side South Boston Pekin Rd