Estimated Value: $291,274 - $385,000
2
Beds
1
Bath
2,394
Sq Ft
$140/Sq Ft
Est. Value
About This Home
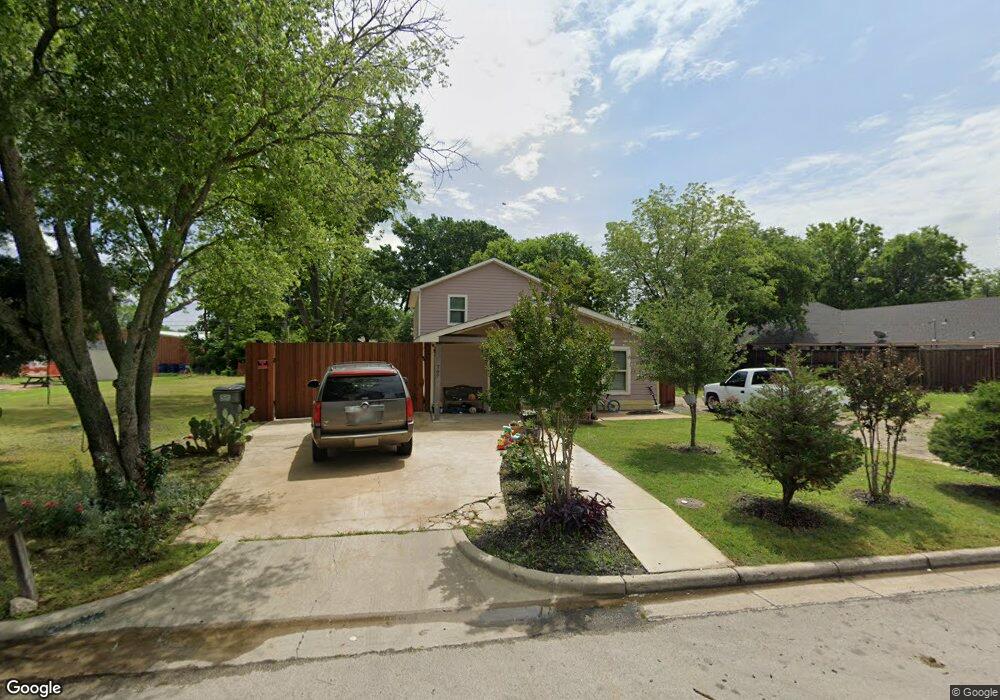
This home is located at 707 S Jackson Ave, Wylie, TX 75098 and is currently estimated at $334,569, approximately $139 per square foot. 707 S Jackson Ave is a home located in Collin County with nearby schools including R F Hartman Elementary School, AB Harrison Intermediate School, and Grady Burnett J High School.
Ownership History
Date
Name
Owned For
Owner Type
Purchase Details
Closed on
Nov 15, 2013
Sold by
Mustang Properties Llc
Bought by
Rodriguez Jose and Rodriguez Maria
Current Estimated Value
Purchase Details
Closed on
Sep 6, 2013
Sold by
Reeves Susan Mccowen
Bought by
Mustang Properties Llc
Home Financials for this Owner
Home Financials are based on the most recent Mortgage that was taken out on this home.
Original Mortgage
$16,000
Interest Rate
4.45%
Mortgage Type
Seller Take Back
Purchase Details
Closed on
Dec 10, 2012
Sold by
Hale Charles D and Hale Bobby F
Bought by
Mccowen Susan
Purchase Details
Closed on
Jul 23, 2012
Sold by
Hale Jerry T
Bought by
Hale Charles D and Hale Bobby F
Purchase Details
Closed on
Jul 9, 2011
Sold by
Hale Charles D and Hale Bobby F
Bought by
Hale Jerry T
Create a Home Valuation Report for This Property
The Home Valuation Report is an in-depth analysis detailing your home's value as well as a comparison with similar homes in the area
Home Values in the Area
Average Home Value in this Area
Purchase History
| Date | Buyer | Sale Price | Title Company |
|---|---|---|---|
| Rodriguez Jose | -- | None Available | |
| Mustang Properties Llc | -- | None Available | |
| Mccowen Susan | -- | None Available | |
| Hale Charles D | -- | None Available | |
| Hale Jerry T | -- | None Available |
Source: Public Records
Mortgage History
| Date | Status | Borrower | Loan Amount |
|---|---|---|---|
| Previous Owner | Mustang Properties Llc | $16,000 |
Source: Public Records
Tax History Compared to Growth
Tax History
| Year | Tax Paid | Tax Assessment Tax Assessment Total Assessment is a certain percentage of the fair market value that is determined by local assessors to be the total taxable value of land and additions on the property. | Land | Improvement |
|---|---|---|---|---|
| 2025 | $3,229 | $250,901 | $70,000 | $236,553 |
| 2024 | $3,229 | $228,092 | $55,000 | $223,929 |
| 2023 | $3,229 | $207,356 | $55,000 | $241,875 |
| 2022 | $4,136 | $188,505 | $45,000 | $245,725 |
| 2021 | $4,032 | $324,774 | $45,000 | $279,774 |
| 2020 | $3,868 | $260,419 | $35,000 | $225,419 |
| 2019 | $3,722 | $141,626 | $35,000 | $236,083 |
| 2018 | $3,467 | $128,751 | $35,000 | $268,427 |
| 2017 | $3,152 | $248,964 | $30,000 | $218,964 |
| 2016 | $1,797 | $64,772 | $12,000 | $52,772 |
| 2015 | $763 | $58,787 | $12,000 | $46,787 |
Source: Public Records
Map
Nearby Homes
- 702 S Ballard Ave
- 416 S 1st St
- 329 S 2nd St
- 804 Memorial Dr
- 327 S 4th St
- 300 S Cottonbelt Ave Unit 3A
- 903 Mardi Gras Ln
- 301 S 3rd St
- 307 Memorial Dr
- 205 S Cottonbelt Ave
- 414 Briarwood Dr
- 300 Woodhollow Ct
- 406 Willow Way
- 401 Willow Way
- 603 Valentine Ln
- 416 Dogwood Dr
- 217 Cloudcroft Dr
- 306 Woodhollow Ct
- 1306 Angel Fire Dr
- 111 N Keefer Dr
- 709 S Jackson Ave
- 705 S Jackson Ave
- 711 S Jackson Ave
- 703 S Jackson Ave
- 713 S Jackson Ave
- 704 S Ballard Ave
- 701 S Jackson Ave
- 710 S Jackson Ave
- 700 S Jackson Ave
- 708 S Ballard Ave
- 700 S Ballard Ave
- 710 S Ballard Ave
- 213 Citizens Ave
- 607 S Jackson Ave
- 202 Jackson Cir
- 115 Jackson Cir
- 800 S Ballard Ave
- 203 Citizens Ave
- 101 Jackson Cir
- 117 Jackson Cir